
As the solar industry matures, so must the approach for using data to create powerful insights and identify areas of opportunity in the market. Geographical information systems have the ability to combine geospatial (location-based) data with typical attribute and tabular data.
For those willing to take some time to engage with the data hands-on, there are many excellent free resources for sourcing geographical information systems (GIS) data, analyzing and visualizing the data, and creating impactful conclusions that give developers and analysts an edge.
QGIS – an open-source platform
First, the user must select a platform for manipulating the geospatial data available. QGIS is currently among the leading desktop GIS programs available. It is a continually-developing open-source platform with a strong community of collaboration, education, and data sharing.
New users can reference the QGIS training manual to get started. Free online beginner GIS courses are available through the University of Toronto and the University of California, Davis through coursera.org.
Once a level of understanding has been reached with the platform, it is time to pull in data and begin your analysis. Here are just a few free datasets at your disposal:
National Renewable Energy Laboratory (NREL)
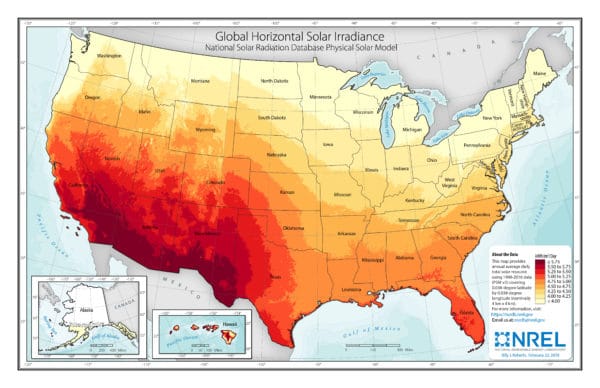 NREL features many tools, maps, and datasets for GIS applications.
PVDAQ features U.S. photovoltaic performance data contributed to NREL, while PVWatts estimates the energy production and cost of energy of grid-connected photovoltaic energy systems throughout the world.
Solar for All visualizes rooftop solar potential by income, building type, tenure occupancy and more in the residential sector. It is a dynamic tool that has data down to the tract level, and allows for custom querying to pull data only from the area you desire.
Energy Information Administration (EIA)
The EIA supplies shapefiles for distribution systems for all major fuel types. Here you can find relevant data for the locations of power plants, electric transmission lines, electric substations, climate zones, and more.
Lawrence Berkeley National Laboratory
For a more advanced user, Berkeley Lab provides scripting tools for renewable energy zoning procedures. They also have a wealth of tabular data about the solar industry.
Regional Datasets
Often, universities and other organizations will make their datasets freely available. For example, MIT provides detailed transmission line and substation shapefiles and other relevant for all of New England. MassGIS provides highly detailed land-use codes down to the parcel level, helping a developer identify top areas for greenfield and brownfield development. With some digging you can find freely available information about most regions across the U.S.
This list is by no means exhaustive, and it should be kept in mind that the data can serve as a backdrop or building block for deeper levels of analysis. Users can join in their internal data in Excel, .csv, and other formats to create new data and visualizations, and even use Python or SQL to create interactive maps.
If the DIY and free methods are too heavy of a lift, there are many companies on the rise providing optimized geospatial data, giving you a direct link to GIS experts and user-friendly tools. RaptorMaps, geothinQ, Galehead Development, and many others are breaking into the solar space as large-scale installations heat up and competitive advantages are increasingly sought.
This content is protected by copyright and may not be reused. If you want to cooperate with us and would like to reuse some of our content, please contact: editors@pv-magazine.com.


By submitting this form you agree to pv magazine using your data for the purposes of publishing your comment.
Your personal data will only be disclosed or otherwise transmitted to third parties for the purposes of spam filtering or if this is necessary for technical maintenance of the website. Any other transfer to third parties will not take place unless this is justified on the basis of applicable data protection regulations or if pv magazine is legally obliged to do so.
You may revoke this consent at any time with effect for the future, in which case your personal data will be deleted immediately. Otherwise, your data will be deleted if pv magazine has processed your request or the purpose of data storage is fulfilled.
Further information on data privacy can be found in our Data Protection Policy.