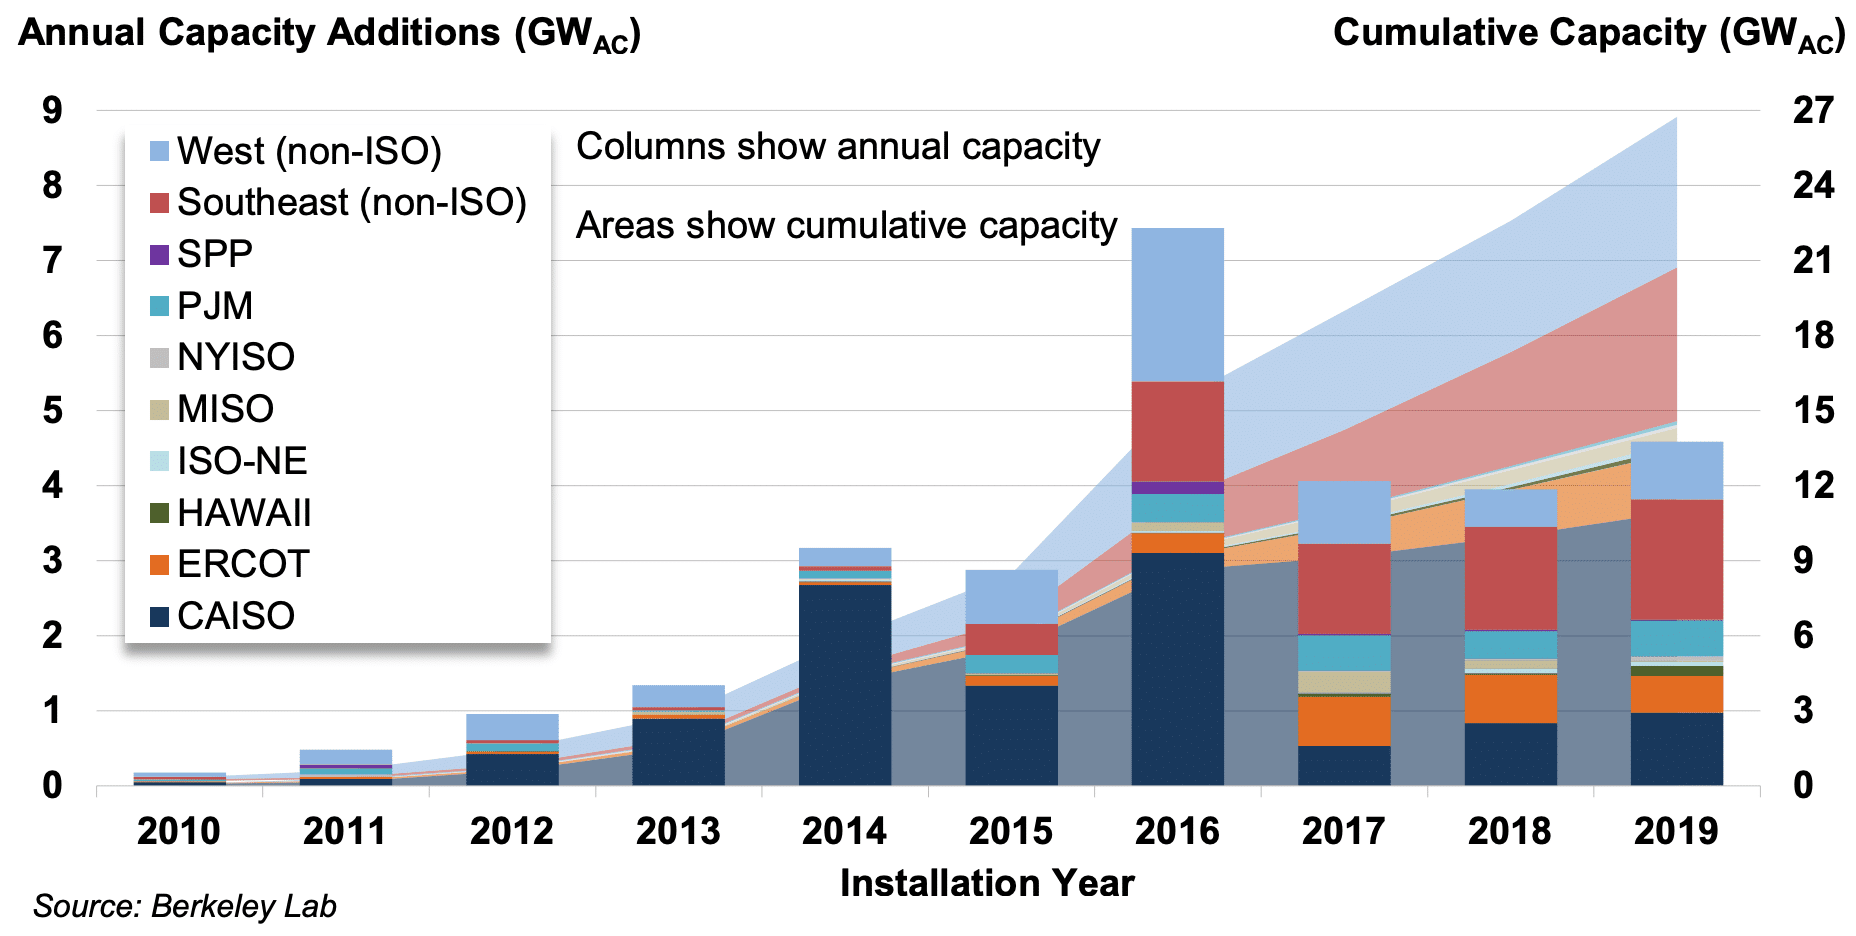
More than 4.5 GW of utility-scale solar came on-line in 2019, bringing the United States’ cumulative capacity over 29 GW, according to Lawrence Berkeley National Lab’s 2020 update of utility-scale solar data and trends.
The report defines “utility-scale” as ground-mounted solar projects larger than 5 MW.
These capacity additions were driven by projects in the Southeast, which accounted for nearly 1.5 GW, followed by California at just under 1 GW. 2019 marks the third year in a row that the Southeast has outpaced California in new capacity additions, a phenomenon unheard of prior to this three-year run.
Across these two regions, the vast majority of completed projects used trackers, with only four projects in Florida using fixed-tilt racking. As you look North, however, the tracker phenomenon flips, with almost half of PJM’s 17 projects utilizing fixed-tilt systems. In fact, there were no documented projects utilizing trackers north of Long Island, though it isn’t specified whether the three solar + storage projects in Massachusetts and Vermont used fixed-tilt or tracking systems. This phenomenon is because single-axis tracking can add roughly five percentage points to a project’s capacity factor in the regions with the strongest solar resource.
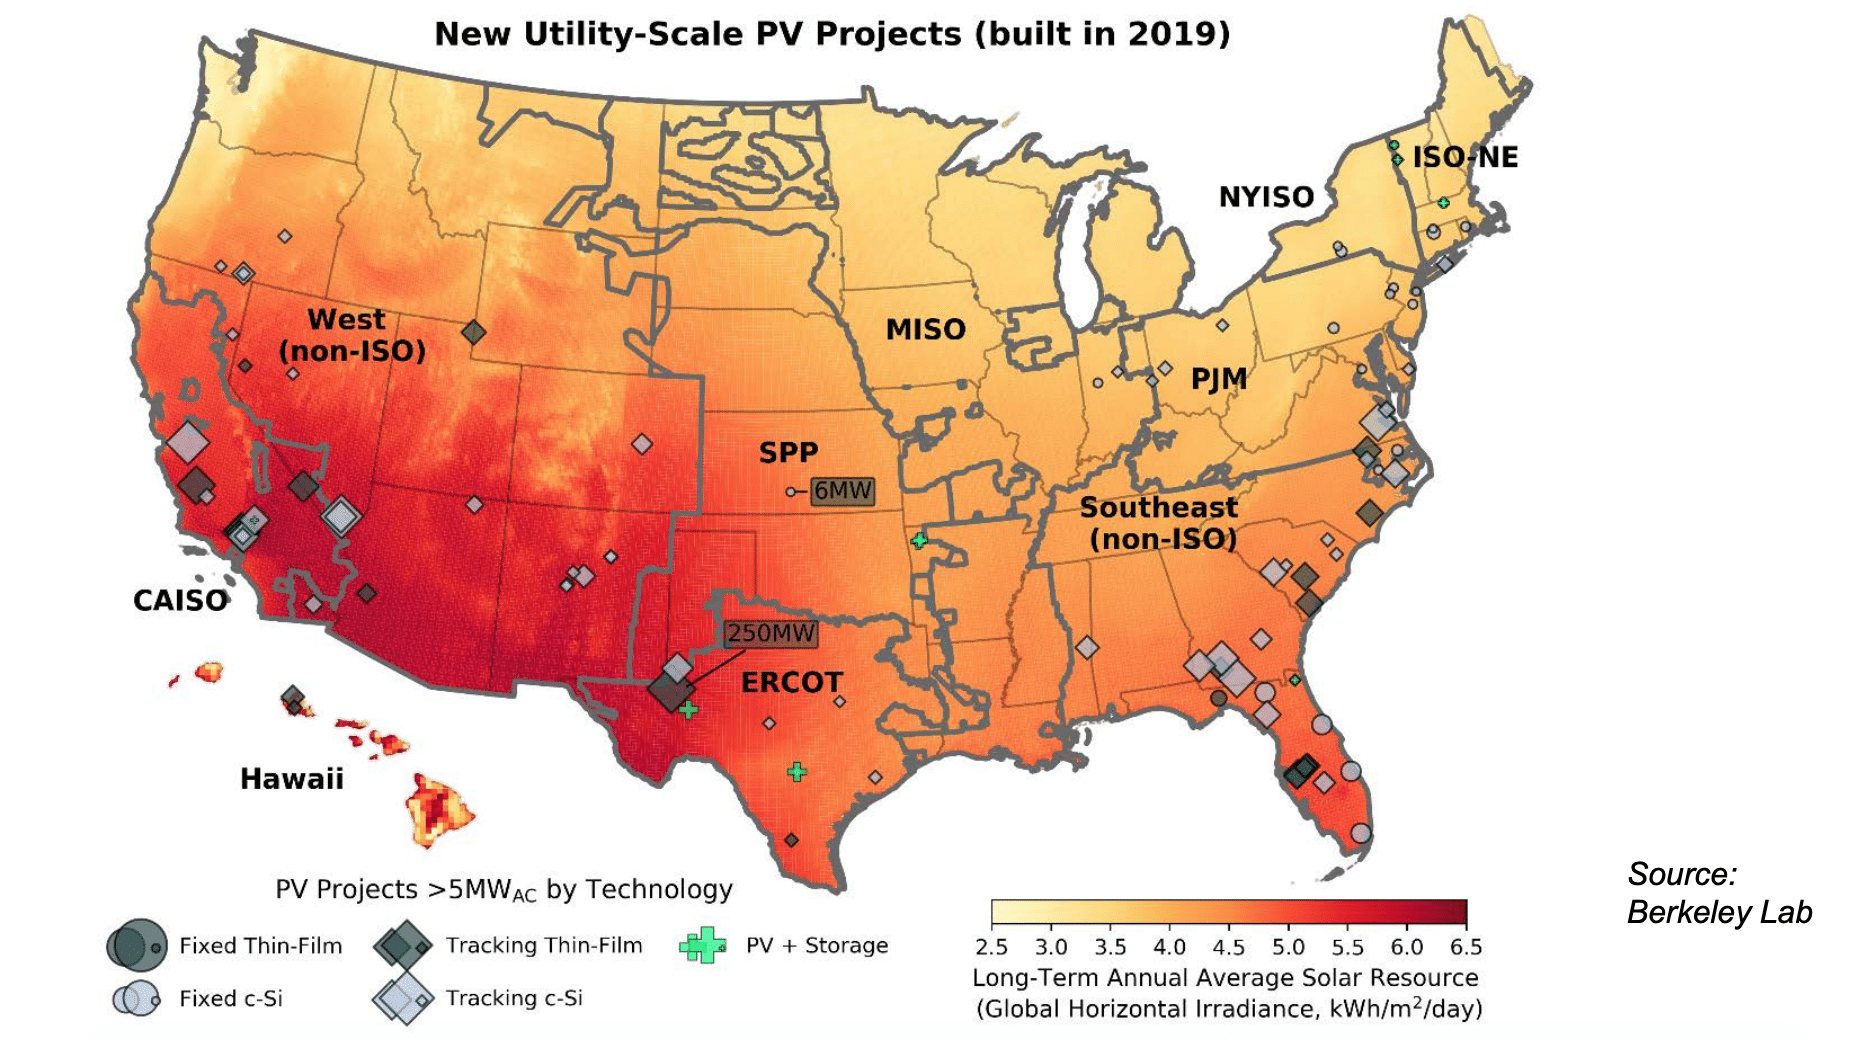
Looking at the country as a whole, the vast majority of new PV projects utilize trackers over racking, with fixed-tilt systems representing roughly 0.5 GW of capacity. 77% of projects and 88% of capacity added in 2019 used single-axis tracking.
Going back to solar-plus-storage, the report shows that nine such projects achieved commercial operation in 2019: two in Vermont, one in Massachusetts, one in Florida, two in Arkansas, two in Texas and one in California.
Solar-plus-storage isn’t the only category where Vermont shined in 2019, as the state was second in the country in terms of solar generation as a percentage of in-state generation. The top spot went to California at 19.9%, followed by Vermont at 14%, Nevada and Massachusetts tied at 13.7% and Hawaii at 12.6%. It should be noted that this data also includes residential and commercial and industrial solar generation.
Costs continue to fall
As for the cost of installing these new projects, that figure is down 20% from 2018’s mark of $1.40/W, coming in at $1.20/W in 2019. This number is also down more than 70% over where it was at the start of the decade.
Projects 5 MW to 20 MW in size, come in at around $1.80/W; 20 MW to 50 MW at just over $1.50/W; 50 MW to 100 MW projects cost $1.30/W; while 100 MW to 200 MW projects are roughly $1.10/W.
187 MW of projects sized 5 MW to 20 MW were installed in 2019, with 434 MW of projects 20 MW to 50 MW, 942 MW for projects sized 50 MW to 100 MW and 565 MW of projects sized 100 MW to 200 MW.
This content is protected by copyright and may not be reused. If you want to cooperate with us and would like to reuse some of our content, please contact: editors@pv-magazine.com.


By submitting this form you agree to pv magazine using your data for the purposes of publishing your comment.
Your personal data will only be disclosed or otherwise transmitted to third parties for the purposes of spam filtering or if this is necessary for technical maintenance of the website. Any other transfer to third parties will not take place unless this is justified on the basis of applicable data protection regulations or if pv magazine is legally obliged to do so.
You may revoke this consent at any time with effect for the future, in which case your personal data will be deleted immediately. Otherwise, your data will be deleted if pv magazine has processed your request or the purpose of data storage is fulfilled.
Further information on data privacy can be found in our Data Protection Policy.