It was projected that this past April, and possibly even May, that we’d see renewable electricity sources temporarily out-generate coal across the whole of the United States. Last year, we saw CO2-free generation from renewables beat CO2-free generation from nuclear for the first five months of 2018. A bit over a month ago we saw California run for over an hour on clean electricity. And if we hop across the pond we’ve seen the UK run coal-free for 18 days straight and Germany run on 47% renewables through the end of May.
The Federal Energy Regulatory Commission (FERC) has released the Energy Infrastructure Update for April of 2019 (pdf), which reveals that the sum of capacity online of renewable electricity sources – hydro, wind, solar, biomass, and geothermal – totaled 21.56%, while coal continued its downward trend falling to 21.55%.
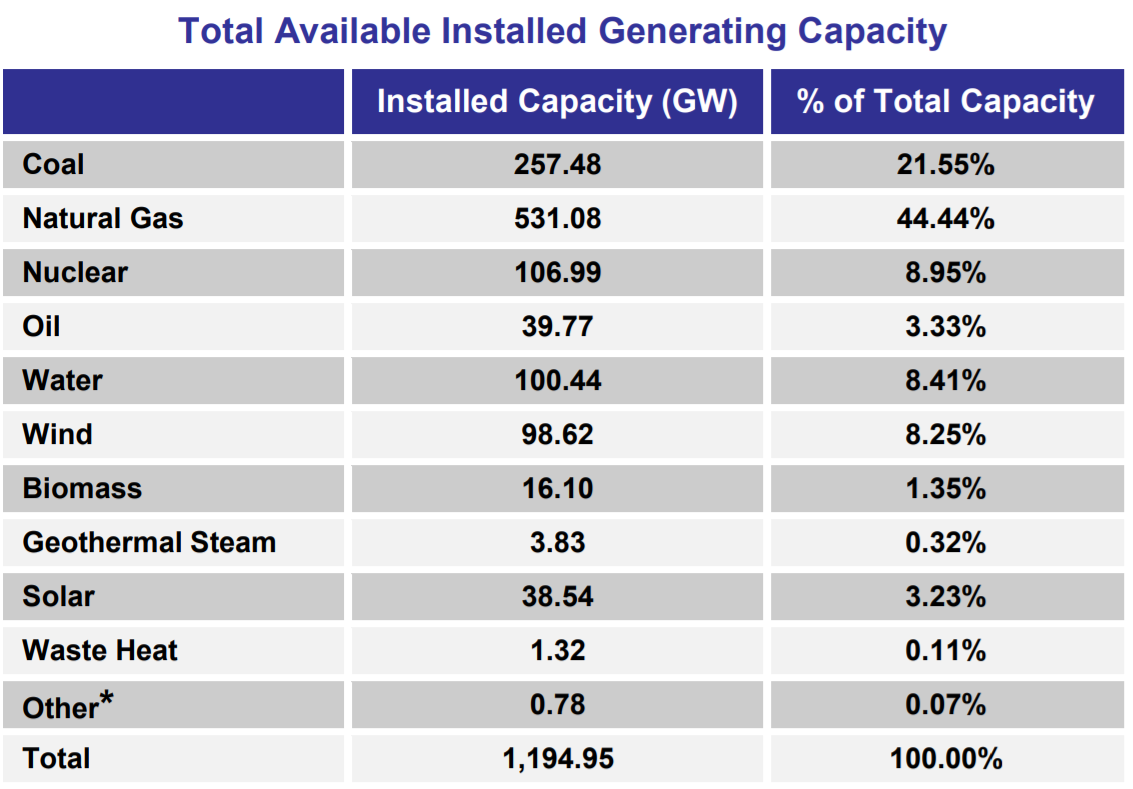
So far on the year, FERC is reporting 3.4 GW of new gas, 1.5 GW of new wind and almost 1.5 GWac of new utility scale solar power; however past analysis has found that FERC often retroactively increases its monthly estimates for solar.
The report also projects that by May of 2022, in the “high probability” batch of construction, we could see a net addition of more than 42 GW of CO2 free generating capacity, compared to a net addition of 5 GW of fossils. Since about 2006, even including the massive gas build-out that occurred in 2018, the United States has held at about the same capacity of coal and gas.
Actual electricity generated varies by source based upon the capacity factor of each resource, which for variable sources like wind and solar is based on season and geographical location. As such, while renewables generated more than coal for the month of April and possibly May, this won’t continue for most of the year, and the same is true for seven months relative to nuclear in 2018. However, back in 2015, we started to see the capacity factors of gas and coal fall. As noted above fossils have stayed flat since 2006 in a market with about flat total electricity generation, but they’re pushing about 10% less electricity in total as of the end of 2018.
Globally in 2013 we saw the first year where total capacity added for renewables – 143 GW – was greater than fossils at 141 GW, and since then the lead by renewables has further widened.
This content is protected by copyright and may not be reused. If you want to cooperate with us and would like to reuse some of our content, please contact: editors@pv-magazine.com.


I would be curious about the 867MW of new coal that FERC has as “High Probability” of being added. Who would be brain dead enough to actually be adding new coal in the U.S. and where?
Good news all around though. FERC is one of the reports I download and do some Excel slicing and dicing of the data. PV has seen pretty large jump in the amount of proposed capacity. I’m still not sure how FERC determines “High Probability” since they just started using that a few months ago and seemingly added it with no explanation. I assume it is along the lines of ERCOT with an IA and secure funding.
Regarding that coal plant – https://t.co/Nll5PLpvvh
Gee, it’s a real shame that of the three, hydro is the only ones of the three that isn’t intermittent. I guess they’re great if you want to power lights in the daytime, or watch television when the wind is blowing the dish around.
Insert battery miracle here.
Will do:
https://pv-magazine-usa.com/2019/06/10/worlds-largest-battery-system-planned-for-nevada-solar-plant/
https://pv-magazine-usa.com/2019/06/04/energy-storage-deployments-double-and-triple-in-first-quarter/
https://pv-magazine-usa.com/2018/12/06/energy-storage-storm-strengthening-deployments-and-pipeline-growing/