Energy modelers and forecasters have a tough job; They’re being asked to tell the future using spreadsheets and algorithms. And to tell the future, there are the considerations of politics, broader global economics, future scientific breakthroughs, and other emergent properties on a globe with seven and a half billion independent actors, which may or may not end up in these models – and not always in ways that we can simply see and predict. Which is why when the EIA publishes its projections it does so considering only the currently enacted legislation – and receives much scorn.
Nonetheless, the modelers will model.
The U.S. Department of Energy’s (DOE) National Renewable Energy Lab (NREL) has begun a collaboration with other expert modeling teams with a long term goal improving variable renewable energy (VRE) deployment models through 2050. Modelers recognize that structures and algorithms for national-scale power system planning and dispatch models rely on numerous simplifications thanks to their broad scope, and that how the unique groups develop these models and solve for these simplifications in their equations can have significant affects on outcomes projected.

NREL collaborated with the modeling teams at the U.S. Energy Information Administration (which uses the NEMS energy model), the U.S. Environmental Protection Agency (IPM), and the Electric Power Research Institute (US-REGEN). NREL’s model is named ReEDS.
As of yet, the collaboration from this effort has delivered two research papers. The first, Variable Renewable Energy in Long-term Planning Models: A Multi-model Perspective (pdf), analyzed models from the three groups above plus NREL’s own models. The documents looks at how the four models treat different aspects of renewable energy, the numerous experiments that were conducted on the models to tease out these differences, the improvements that have been made to the models already, and a blueprint to enable further advancements.
Some of the variances between the models include: transmission and generation resource data, capacity value, dispatch and operational modeling, distributed generation volumes deployed, and temporal and spatial resolution.
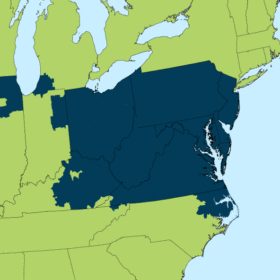
For instance, the below map shows how the models see the USA spatially:

The four models each break down the United States differently: 64 IPM regions (top left), 22 regions for the NEMS model (top right), 134 ReEDS balancing area regions (bottom left), and 48 US-REGEN states (bottom right).
One of the effects of this difference was shown in that in models with fewer regions, there were fewer transmission constraints, making it easier to access lower-cost remote renewable resources. Total system costs were approximately 2% lower in the 15-region case than in the 48-region case. This model would project a lower volume of distributed renewable assets.

The second paper, The role of input assumptions and model structures in projections of variable renewable energy: A multi-model perspective of the U.S. electricity system, shows that even when the models normalized the input variables their outcomes can greatly vary. The first image in this article shows three models projecting a difference in deployments between below 20% of total electricity to greater than 40% in their “Business as Usual” projection. The image just above, the “Low Carbon” projection, shows a variance of between around 30% to just below 60%.
Some of the original inputs considered for utility scale pv across the three models analyzed were:

In paying respect to the complex interactions of their models and the reality of our complex politics, the first paper mentioned in this series offered the following note at the end of its executive summary:
This research is intended to inform the energy modeling community on the modeling of variable renewable resources, and is not intended to advocate for or against any particular energy technologies, resources, or policies.
This content is protected by copyright and may not be reused. If you want to cooperate with us and would like to reuse some of our content, please contact: editors@pv-magazine.com.


EIA report produces scorn because their modeling method seems to be ignore the trend and:
1. Draw straight horizontal line from current coal generation percentage
2. Draw straight horizontal line from current renewable generation percentage
At least this year they admit there will be more renewable capacity added for the next few years and then magically none forevermore.