Oftentimes we hear people ask: “What happens when the sun goes down?” when wondering about the lengths that solar power can go. The most appropriate response might be, “We plan for when the sun comes up.” And this is because, while solar power not be fully dispatchable (without batteries) to meet the needs of our modern society, the sun rising and setting might be the most predictable event in all of the energy industry.
Fitch Ratings has released a report, Global Renewables Performance Review:
Solar Outperforms Wind on a Global Scale, covering 41 wind projects and 16 solar power projects and has found that solar power projects solar projects consistently outperformed wind projects, as reflected in volume risk assessments and generally higher production ratings.
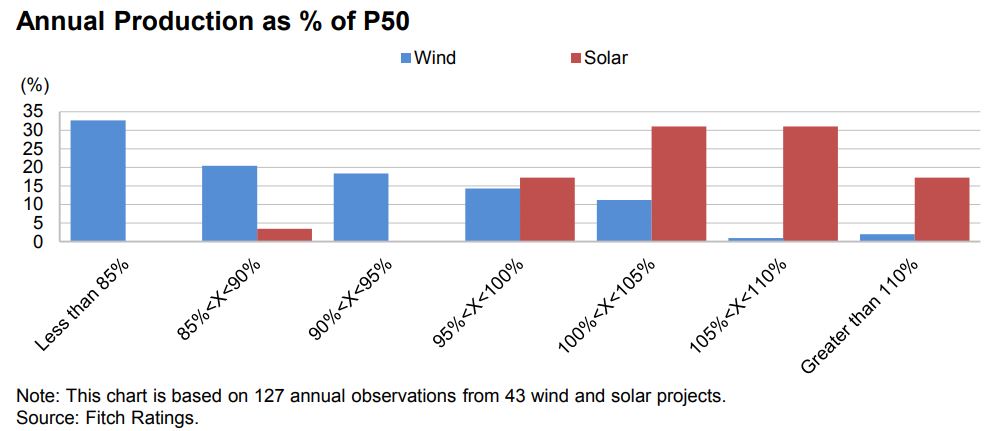
Fitch found 79% of annual observations across solar projects were at or above the original P50 levels and only 3% were significantly (i.e. more than 10%) below the initial forecasts, which are provided by independent resource consultants. Around 85% of wind project observations were below P50 level and 53% were more than 10% below.
Fitch Ratings Director Andrew Joynt said:
Solar projects are demonstrating lower operational risk, better generation performance and lower volatility. Solar projects also tend to meet or exceed initial volume estimates while wind projects more often underperform against expectations.
Fitch notes that it has actually upgraded 19% of its rated solar projects compared to 1% for its for wind projects. And, while 12% of wind projects have been downgraded on their own accords, for solar power, volatility of revenue counterparties – most recently with Pacific Gas & Electric Co.’s (PG&E) and its plans to file for Chapter 11 bankruptcy – have been the greatest driver of solar power downgrades.
These numbers though, are actually very strong for wind power – as Fitch states both technologies have a strong track record. Most projects employ proven technologies and there now exists a pool of well known operators with established track records. The average project in Fitch’s wind portfolio achieved availability of at least 97% for five straight years. Solar projects regularly top 98%.
DNV GL did a great write up on the statistical significance of P50 and P90 ratings, and many of our bond rating reviews of securitized (example 1, example 2) solar power include P50 and P90 ratings by the Kroll Bond Ratings Agency.
When we consider the broader energy market, wind and solar power are quite compatible and complementary. For instance, in an analysis of Northern Atlantic wind resources, the seasonality of wind and solar power were shown to fit together well:


And this complementary nature of wind+solar was further analyzed by these same researchers later to determine that we could meet 80% of US electricity with a slightly heavy mix of solar plus wind and 12 hours of energy storage. If nationwide HVDC power lines were added to the mix, wind and solar – plus a bit of solar oversizing – could easily power the United States.
It is projected that wind and solar will break 10% of U.S. electricity generation in 2019, and 12% in 2020 as they are the fastest growing sources of electricity in the country per the U.S. Department of Energy’s Energy Information Administration.
This content is protected by copyright and may not be reused. If you want to cooperate with us and would like to reuse some of our content, please contact: editors@pv-magazine.com.


By submitting this form you agree to pv magazine using your data for the purposes of publishing your comment.
Your personal data will only be disclosed or otherwise transmitted to third parties for the purposes of spam filtering or if this is necessary for technical maintenance of the website. Any other transfer to third parties will not take place unless this is justified on the basis of applicable data protection regulations or if pv magazine is legally obliged to do so.
You may revoke this consent at any time with effect for the future, in which case your personal data will be deleted immediately. Otherwise, your data will be deleted if pv magazine has processed your request or the purpose of data storage is fulfilled.
Further information on data privacy can be found in our Data Protection Policy.