The U.S. Department of Energy’s Energy Information Administration (EIA) is the formal, official source for data on the U.S. electricity system, and since it started tracking distributed PV a few years ago, solar is no longer an exception.
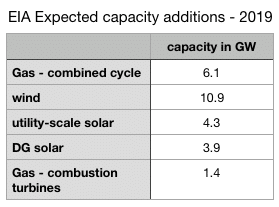
Earlier this week EIA announced its projections for new capacity to come online in 2019, including solar and wind. And while EIA did not include distributed solar in the graphics in a post in Today in Energy, it gave an estimate of new distributed solar via its Short-Term Energy Outlook. From these two sources we find 4.3 GWac of utility-scale solar and 3.9 GWac of distributed solar, modest market growth over we think was installed in 2018.
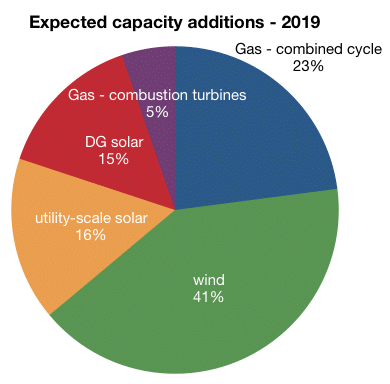
Overall, EIA expects solar and wind to dominate new capacity additions, as they have for most of the decade. 2018 may have been an exception to this rule, due to a rush to build gas plants mostly in the PJM Interconnection. We don’t have final 2018 numbers, but based on the projections by Wood Mackenzie and IHS Markit, it looked like the capacity of new natural gas plants was going to narrowly exceed that of combined new wind and solar.
Geography, retirements and additions
2019 looks like a return to a more reasoned pace, with wind and solar again dominating capacity additions. One of the biggest factors affecting the market in 2018 was the retirement of an estimated 11.9 GWac of coal plants, and EIA expects that pace to slow this year, with the retirement of the 2.3 GWac Navajo Generating Station making up roughly half of the 4.5 GWac of coal that is expected to retire in 2019.
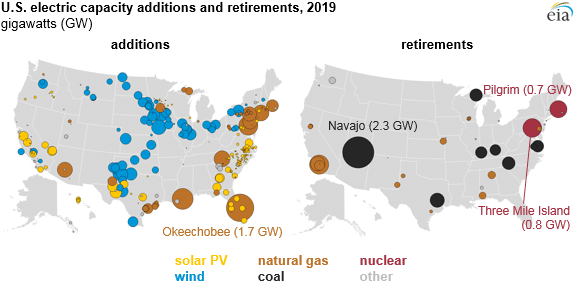
The map of retirements and additions shows many familiar elements, such as wind plants coming online in the Plains States and gas being added in the Northeast and Florida. However, there are some quirks, such as a massive gas plant being added in Louisiana, and utility-scale solar coming to Florida and Texas. But as this map does not show distributed solar, the geography of these additions is less clear.
Market could beat expectations
if anything, EIA’s forecast for solar may be conservative.
It is challenging to compare EIA to the Wood Mackenzie / Solar Energy Industries Association (SEIA) forecasts in the U.S. Solar Market Insight report series, as EIA uses AC values and Wood Mackenzie DC. However, if we assume a DC:AC ration of 1.25:1 for distributed solar and 1.4:1 for utility-scale, we have EIA forecasting around 10.9 GWdc of solar in 2019.
This appears to be slightly below what Wood Mackenzie is projecting, as the organization expects 7.2 GWdc of utility-scale solar alone during 2019, well above what EIA forecasts.
In Today in Energy EIA touts that its track record for 12-month forecasts is solid. However, the organization also concedes that 660 MWac more solar came online in 2017 than was expected at the end of 2016, which is not hard to imagine given that in many ways solar development is still the Wild West, and the massive job involved in collecting data from every developer in the United States, and how projects don’t always happen on the timelines that developers are predicting.
Furthermore, the massive volumes of solar projects in the interconnection queues of grid operators suggest that much more solar could be coming than anyone has forecast.
On January 1 pv magazine reported that there are 139 GWac of solar projects in the interconnection queues of six grid operators. Since that time we have received numbers from the Southwest Power Pool, which pushes this up to 164GWac – and keep in mind that this doesn’t cover the South or most of the Mountain West.
This content is protected by copyright and may not be reused. If you want to cooperate with us and would like to reuse some of our content, please contact: editors@pv-magazine.com.


I realize that the 164GW in the FERC pipeline is 3 year pipeline, but even half the pipeline would put us at 27GW/year. Now that would be cooking (without gas)!
Using the EIA data so far (through Oct) this year 68% of project NG capacity has come online. This compares to wind (89%), solar (94%) and battery (243%).
Thanks. Actually the 164GWac is in grid operator interconnection queues, and any given project could be built as late as 2023. FERC has a different number for its 3-year pipeline.
I actually should have known that since I started looking at FERC data a couple of months ago. Currently (November data) the 3 year pipeline for solar addition is 64GW (~21GW/year). This is up from 47GW at the end of 2017. So, pipeline growth of 17GW in 11 months. Not bad. Hopefully most of the projects make it to completion.