
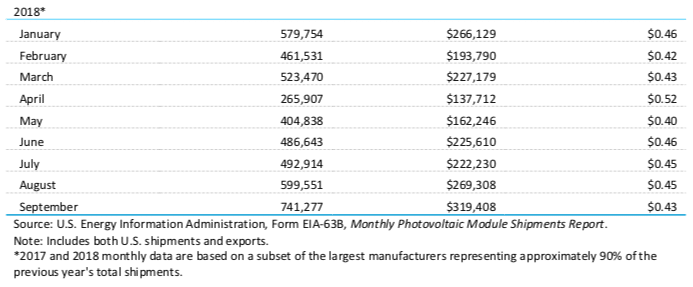
The U.S. Department of Energy’s Energy Information Administration (EIA) is not known for closely tracking solar. In fact, the organization’s 2018 Monthly Solar Photovoltaic Module Shipments Report – which is not consistently published every month – is a remarkably thin document, with most of the data fields not published at a monthly level.
However, one of the few tables in the document shows an aggregate total of 600 MW of PV modules being shipped in August, and 741 MW in September – the highest levels since the pre-Section 201 tariff rush to secure modules in the last seven months of 2017. These were overwhelmingly imports, with 582 MW of imports in August and 601 MW in September.
And while this is only one data point – and a limited one at that – combined with other evidence, there is a case to be made that the nation is getting ready for another great boom in solar project construction. As recently reported by pv magazine USA, S&P Global Market Intelligence is estimating that over the last two quarters the U.S. utility-scale solar project pipeline has ballooned to 23 GW.
We’re seeing evidence of this from grid operators as well. The MidContinent Independent System Operator (MISO) is reporting 35 GW of solar projects in its interconnection queue, nearly all of which were added this year and last year. ERCOT also reports 32 GW of solar projects in its latest interconnection queue, and although only 3.9 GW of these have interconnection agreements, the vast majority of projects that ERCOT is reporting are solar and wind.
One major factor in this boom in project activity may be a rush to get projects started before the federal Investment Tax Credit (ITC) declines at the end of 2020, as current IRS guidance requires that projects must start construction activity by that time but don’t need to be completed by that date (utility scale projects are not allowed to use solar modules alone for their “safe harbor” qualification).
Another may be the increasing number of states and regions that are either passing 100% renewable or clean energy mandates, or threatening to. , with Wood Mackenzie Power & Renewables estimating that proposed renewable energy mandates in five states could add 17.7 GWac of solar by 2030.
And a third may be simply that utilities and developers are increasingly seeing that solar is an affordable, predictable resource that is becoming easier to finance, and in many places large-scale solar is the cheapest source of power available.
This content is protected by copyright and may not be reused. If you want to cooperate with us and would like to reuse some of our content, please contact: editors@pv-magazine.com.


By submitting this form you agree to pv magazine using your data for the purposes of publishing your comment.
Your personal data will only be disclosed or otherwise transmitted to third parties for the purposes of spam filtering or if this is necessary for technical maintenance of the website. Any other transfer to third parties will not take place unless this is justified on the basis of applicable data protection regulations or if pv magazine is legally obliged to do so.
You may revoke this consent at any time with effect for the future, in which case your personal data will be deleted immediately. Otherwise, your data will be deleted if pv magazine has processed your request or the purpose of data storage is fulfilled.
Further information on data privacy can be found in our Data Protection Policy.