It’s not just California anymore.
From 2005 to 2017, solar generation has gone from a statistical rounding error (~.01%) to 1.9% of U.S. electricity generation, and wind rose from 0.4% to 6.3% of generation. However, until now we were not really sure what impact that had on emissions.
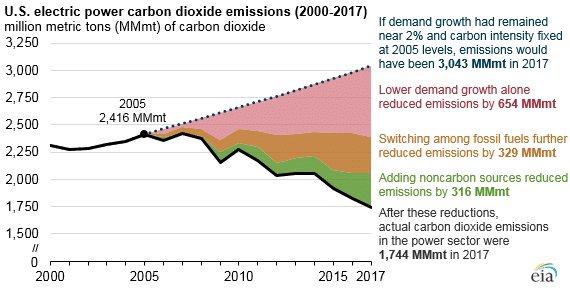
Turned out that this was quite a bit. The U.S. Department of Energy’s Energy Information Administration (EIA) has reported that U.S. electricity sector emissions fell 28% from 2005 to 2017, from 2.42 billion metric tons to 1.74 billion metric tons. According to its analysis, “zero-carbon emitting sources” represented 316 metric tons of emissions reductions – or nearly half the fall.
What EIA really means is wind and solar, and here the numbers speak for themselves. While nuclear generation rose by 23 terawatt-hours (TWh) annually over this period and hydroelectric generation by 30 TWh, wind increased 236 TWh, and solar 76 TWh, as the largest sources of new generation to come online.
Additionally there was some increase in various forms of biomass and geothermal, but this was smaller than either nuclear or hydro increases. And as these sources have grown, they have eaten into the share of total coal, gas and petroleum-fired generation. According to EIA’s numbers, this contribution by new renewable energy (all forms) and a slight increase in nuclear combined to 13% lower emissions levels over the 2005-2017 timeframe.
This follows similar analyses by California’s grid operator which document a fall in electricity sector emissions as renewable energy replaces gas generation.
The other 15% of total U.S. emissions reductions is attributed to the switch from coal to gas, but here measuring only CO2 can be misleading, and CO2 equivalence is not clear. Nearly all gas consumed in the United States is extracted in North America, and the boom in gas production over this period is due to hydraulic fracturing (fracking). Both the fracking process and the transport of gas via pipelines involve leaked methane (CH4), termed “fugitive emissions”.
EIA’s brief synopsis only mentions CO2, does not mention whether or not it is calculating fugitive CH4 emissions, the actual volume of which has long been unclear. Furthermore the intensity of CH4 as a greenhouse gas versus the standard of CO2 is also subject to interpretation, as CH4 has a much greater impact over a 20-year timeframe versus a 100-year timeframe.
Gas and renewables aside, the other factor in falling power sector emissions is something that didn’t happen. While electricity demand rose 1.9% annually from 1996 to 2005, since 2005 demand has been essentially flat, falling 0.1% annually. Had it continued to increase 1.9% per year, EIA says that this would have resulted in 654 million metric tons of additional emissions.
While there are many possible contributing factors to this decrease in electric demand – which is happening despite population growth – the energy intensity of economies is declining globally.
But while electricity sector emissions are decreasing, the bad news is that overall greenhouse gas emissions in the United States are not showing similar progress. According to EIA, while electricity sector emissions fell 28% over this time period, emissions from all other sources fell only 5%.
This content is protected by copyright and may not be reused. If you want to cooperate with us and would like to reuse some of our content, please contact: editors@pv-magazine.com.


By submitting this form you agree to pv magazine using your data for the purposes of publishing your comment.
Your personal data will only be disclosed or otherwise transmitted to third parties for the purposes of spam filtering or if this is necessary for technical maintenance of the website. Any other transfer to third parties will not take place unless this is justified on the basis of applicable data protection regulations or if pv magazine is legally obliged to do so.
You may revoke this consent at any time with effect for the future, in which case your personal data will be deleted immediately. Otherwise, your data will be deleted if pv magazine has processed your request or the purpose of data storage is fulfilled.
Further information on data privacy can be found in our Data Protection Policy.