Even among the remarkable work done by the U.S. Department of Energy’s network of national labs, Lawrence Berkeley National Laboratory (LBNL) stands out for its research on solar. And while the lab’s annual reports on PV system costs are eagerly awaited by many, this is only the tip of the iceberg in terms of the data LBNL publishes.
Yesterday the lab published Utility-Scale Solar 2016, the fifth edition of its annual report on projects’ costs, performance and pricing trends. This veritable encyclopedia of data for solar geeks includes figures on the geography of installations, installed prices, capacity factors and operations and maintenance costs, but what stands out as a top-line statistic is the dominance of tracking technology.
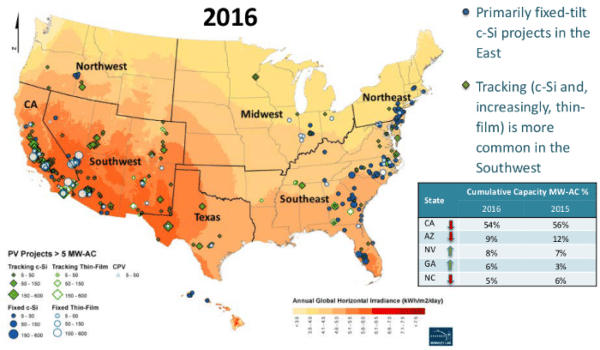
According to LBNL, 79% of the new utility-scale solar capacity (defined as projects larger than 5 MW) that came online in 2016 featured tracking systems, for a total of 5.8 GW. The overwhelming majority was single-axis tracking, although a few OCI Solar projects in Texas with dual-axis tracking supplied by Sun Action Trackers have come online in recent years.
![]()
LBNL’s data shows trackers becoming increasingly popular not only for crystalline silicon projects but also those using First Solar’s cadmium telluride solar, which dominates utility-scale thin film applications. The report says that prior to 2014, only two projects with thin film modules using tracking had ever been built in the United States, whereas in 2016 64% of new thin-film utility-scale solar capacity was mounted on trackers.
LBNL notes that the lower efficiency of thin-film modules has traditionally meant that more land was required for installations and that tracking exacerbated that problem. However, First Solar’s recent increase in module efficiencies to levels closer to crystalline silicon has changed that.
And as large-scale solar moves into a wider range of geographies, tracking is moving with it. During 2016 LBNL reported the first PV projects larger than 5 MW in the Northwest, and more than half of these used tracking technology. The report also found four tracking projects in the Midwest, and even one in Pennsylvania – although in the Midwest and Northeast fixed-tilt installations still dominated.
Capacity factors
Another seldom-reported metric to be found in Utility-Scale Solar is capacity factors, broken down by region. Looking across 260 different utility-scale PV projects, the report found a range of 15.4-35.5% in AC terms, with the median capacity factor coming in just above 26%.
That simple number belies a range of differences, including those caused by geography and technology. LBNL finds that the addition of tracking systems boost capacity factors by 3-5% percentage points, which put the average capacity factor for projects in California using tracking coming in above 30%.
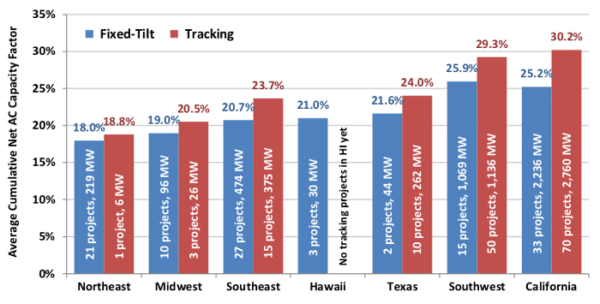
The Northeast showed the lowest capacity factors at 18-19% (depending on whether or not such projects used tracking), followed by the Midwest. However projects in the Southeast are reporting capacity factors in the 21-24% range, with Texas slightly above that. The Southwest still offers the best output, roughly similar to California.
The date of the installation is also a factor, however the raw data shows that capacity factors for U.S. projects put online in 2014 and 2015 are slightly below those in 2013, which is likely due to a spread of utility-scale solar to a wider range of geographies with less sunlight.
This content is protected by copyright and may not be reused. If you want to cooperate with us and would like to reuse some of our content, please contact: editors@pv-magazine.com.


By submitting this form you agree to pv magazine using your data for the purposes of publishing your comment.
Your personal data will only be disclosed or otherwise transmitted to third parties for the purposes of spam filtering or if this is necessary for technical maintenance of the website. Any other transfer to third parties will not take place unless this is justified on the basis of applicable data protection regulations or if pv magazine is legally obliged to do so.
You may revoke this consent at any time with effect for the future, in which case your personal data will be deleted immediately. Otherwise, your data will be deleted if pv magazine has processed your request or the purpose of data storage is fulfilled.
Further information on data privacy can be found in our Data Protection Policy.