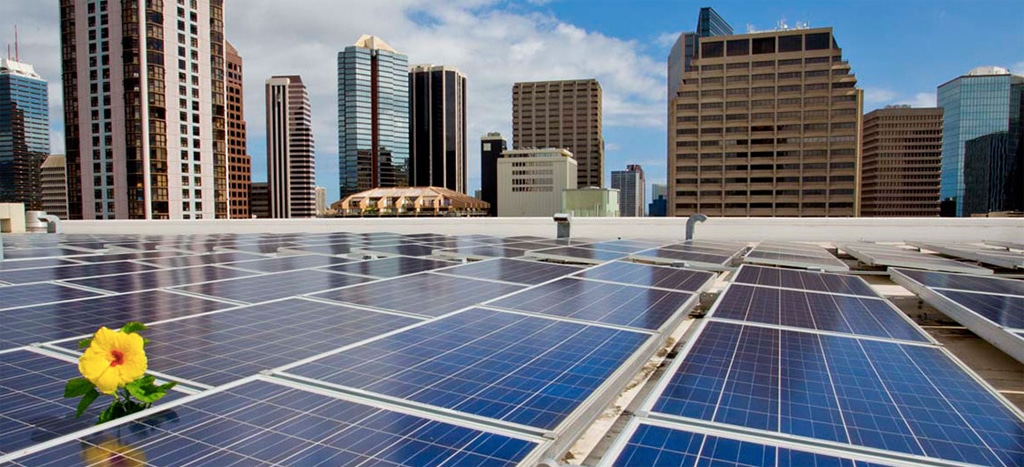
The progress of solar PV in the United States in the last few years has been nothing less than breathtaking. And despite a limited area to deploy solar, cities have been an important part of that progress, as documented by Environment America in its report series, Shining Cities.
However, the latest edition of this report lists a series of top cities in the per-capita ranking that are undergoing policy changes which are slowing their distributed generation solar markets.
The top two cities in 2016 for per-capita solar are prime examples of this phenomenon. Honolulu kept the top spot this year with a massive 495 watts of installed solar per resident, a 19% growth over the previous year.
However, At the beginning of 2017 the city’s solar market has slowed substantially, with an average of only 124 permits approved for PV systems per month in January and February, as opposed to an average of 167 per month in 2016 and 192 per month in the last half of 2015.
This is doubtless the result of Hawaii scrapping its net metering regulation and moving to a self-consumption model, which makes battery storage a de-facto component of residential PV systems. As has been noted by National Renewable Energy Laboratories, this makes PV systems much more expensive, with even a small battery doubling the cost of a typical PV system.
San Diego, California has also had its ups and downs. In 2016 the city climbed two spots to reach 1st place in overall installed capacity, with 303 MW, and second place in solar density, at 218 watts per resident.
And while California still has a net metering regulation in place, San Diego Gas & Electric Company (SDG&E) was the first to reach a capacity cap on the original program, and to transition to a successor program including mandatory time-of-use rates. According to installers and industry groups pv magazine spoke with the roll-out of these rates was less than perfect, and as a result the residential solar market in SDG&E service area fell by 1/3 during the second half of the year.
San Jose, California also increased deployment, while remaining in third place for the per-capita ranking at 169 watts/resident. It took longer for Pacific Gas & Electric Company (PG&E), whose service area covers the San Francisco Bay Area including San Jose, to reach program caps. However, the utility transitioned to Net Metering 2.0 in late December, and pv magazine is currently waiting on deployment statistics for the first three months of 2017.
Statewide changes to net metering are also issues for cities number four and six on the per-capita ranking, Indianapolis and Las Vegas. Indiana’s House of Representatives is currently considering a bill to dismantle the state’s net metering policy, and Nevada already took this step at the end of 2015.
Despite this Las Vegas installed 17 MW of solar in 2016 and moved up one spot in the rankings. Roughly half of this came from the rooftop system on the Mandalay Bay Convention Center, and the city government’s commitment to 100% renewable energy may also be a contributing factor.
And even for the cities which have installed large volumes of solar, there is still ample space to deploy more. Environment America estimates that San Diego has developed less than 14% of its technical potential for solar energy on small buildings.
This content is protected by copyright and may not be reused. If you want to cooperate with us and would like to reuse some of our content, please contact: editors@pv-magazine.com.


By submitting this form you agree to pv magazine using your data for the purposes of publishing your comment.
Your personal data will only be disclosed or otherwise transmitted to third parties for the purposes of spam filtering or if this is necessary for technical maintenance of the website. Any other transfer to third parties will not take place unless this is justified on the basis of applicable data protection regulations or if pv magazine is legally obliged to do so.
You may revoke this consent at any time with effect for the future, in which case your personal data will be deleted immediately. Otherwise, your data will be deleted if pv magazine has processed your request or the purpose of data storage is fulfilled.
Further information on data privacy can be found in our Data Protection Policy.