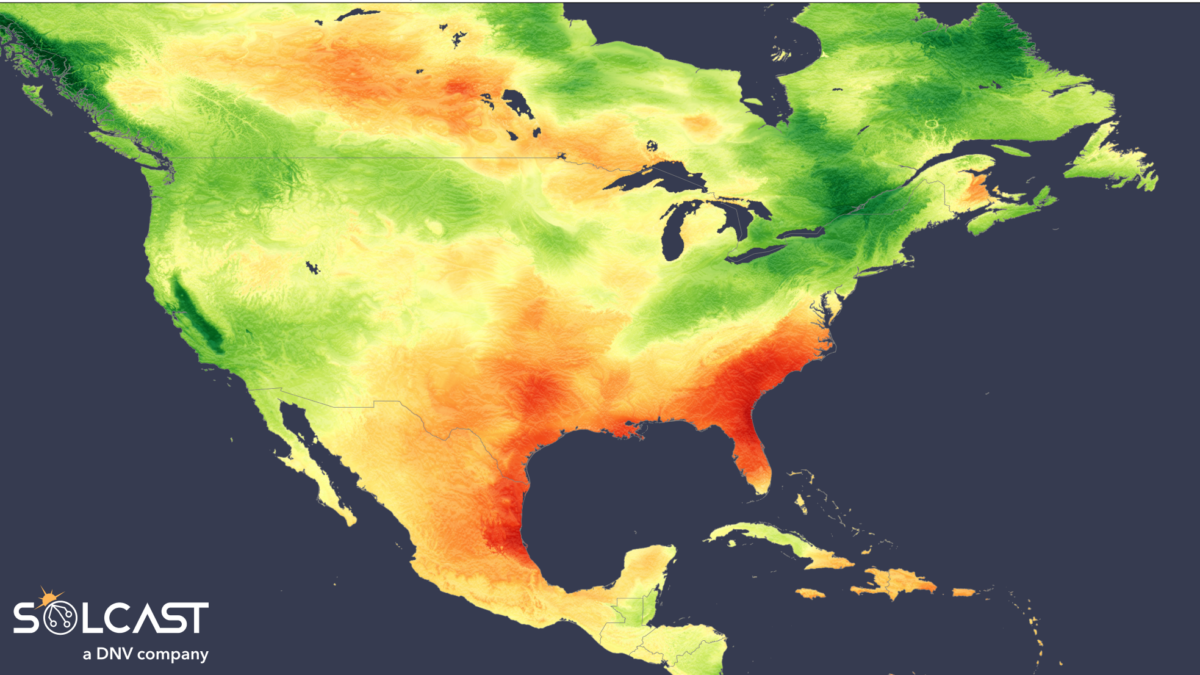
Irradiance patterns across North America in November showed a stark east-west divide, according to analysis using the Solcast API. The southeastern United States and Mexico recorded strong positive anomalies, while the western regions endured persistent cloud cover and heavy rainfall, driving irradiances well below average. Seasonal forecasts suggest this pattern will persist through December, with only minor shifts in the southwest.

The month was particularly sunny for the South East United States and Mexico. Areas adjacent to the Caribbean Sea saw irradiances up to 30% above climatology, extending inland across most of Mexico and the southern U.S., reaching portions of the Midwest. Eastern states from Florida through Virginia and up to New Jersey also benefited from clear skies. In contrast, the far northeast experienced negative anomalies, which further reduced irradiance during a season with already characteristically high solar zeniths. These conditions were linked to a negative North Atlantic Oscillation, which established a blocking pattern that not only favored clear skies in the southeast but also brought colder than-average weather to eastern Canada and parts of the U.S..
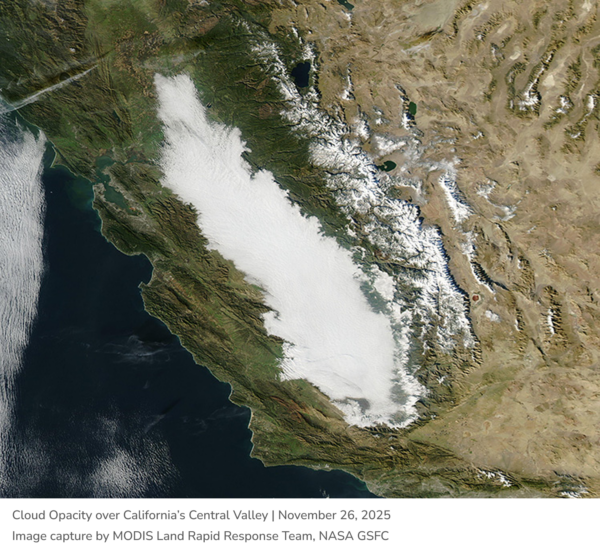
Meanwhile, the western half of the continent faced a very different scenario. November was dominated by an atmospheric river that delivered heavy rain, dense cloud cover, and widespread fog. Irradiances fell 10–20% below climatology across much of the western and northern U.S., Baja California, and parts of western Canada. Central California’s Central Valley saw the signature of “Tule fog” in the data, with anomalies plunging as much as 40% below average. This persistent instability also drove record or near-record November rainfall at several locations, reinforcing the suppression of solar resources.

Current anomalies align closely with seasonal forecasts issued earlier in the month, which anticipated strong irradiance in the southeast and subdued conditions in the west. This pattern is expected to hold through December, with the exception of a flip in the southwest U.S..
Solcast produces these figures by tracking clouds and aerosols at 1-2km resolution globally, using satellite data and proprietary AI/ML algorithms. This data is used to drive irradiance models, enabling Solcast to calculate irradiance at high resolution, with typical bias of less than 2%, and also cloud-tracking forecasts. This data is used by more than 350 companies managing over 300 GW of solar assets globally.
The views and opinions expressed in this article are the author’s own, and do not necessarily reflect those held by pv magazine.
This content is protected by copyright and may not be reused. If you want to cooperate with us and would like to reuse some of our content, please contact: editors@pv-magazine.com.


By submitting this form you agree to pv magazine using your data for the purposes of publishing your comment.
Your personal data will only be disclosed or otherwise transmitted to third parties for the purposes of spam filtering or if this is necessary for technical maintenance of the website. Any other transfer to third parties will not take place unless this is justified on the basis of applicable data protection regulations or if pv magazine is legally obliged to do so.
You may revoke this consent at any time with effect for the future, in which case your personal data will be deleted immediately. Otherwise, your data will be deleted if pv magazine has processed your request or the purpose of data storage is fulfilled.
Further information on data privacy can be found in our Data Protection Policy.