North American solar conditions in August were shaped b multiple severe phenomena, with both fire and storm activity leading to highly variable irradiance across the continent. Wildfire smoke from ongoing Canadian fires and tropical weather systems in the US southeast drove irradiance down in central and eastern regions, while high pressure systems in the northeast delivered above average solar conditions. These patterns led to notable regional contrasts in PV performance, according to analysis using the Solcast API.
![]()
The most significant negative anomalies were observed in the central provinces of Canada and across the US Midwest and Southeast. Canadian wildfires, which have persisted throughout the summer, continued into August, blanketing Saskatchewan and Manitoba in smoke haze. This aerosol loading led to irradiance reductions of up to 15% in these provinces. Prevailing winds carried the smoke into midwestern US states including Minnesota, Wisconsin, and Iowa, where irradiance levels fell approximately 10% below climatological norms. These smoke impacts were visible in clear sky anomaly analyses, showing that irradiance was suppressed independent of cloud cover.
![]()
Further south and east, solar generation was constrained by an active Atlantic hurricane season. Tropical Storm Dexter, which developed early in August near the US Southeast coast, and later Category 5 Hurricane Erin, which remained offshore but influenced regional weather patterns, both suppressed irradiance in Georgia and the Carolinas. Even without a direct landfall, Hurricane Erin’s extensive cloud shield reduced available sunlight across the region, contributing to monthly irradiance totals around 10% below average. Meanwhile the Great Plains were affected by enhanced convective activity with frequent thunderstorms leading to similarly reduced solar availability.
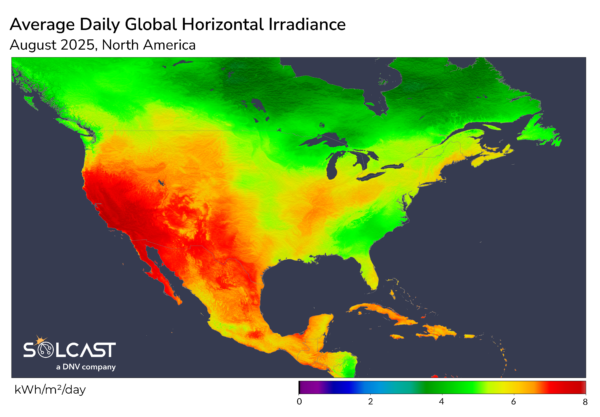
In contrast, northeastern parts experienced favorable solar conditions. High pressure systems dominated weather patterns in New England and eastern Canada, bringing clearer skies and boosting irradiance. ISO New England benefited from this pattern, with daily irradiance levels climbing to approximately 5.7 kWh/day, compared to the long-term August average of around 5 kWh/day. Ontario, Nova Scotia, and parts of Quebec similarly enjoyed sunnier-than-average conditions.
Solcast produces these figures by tracking clouds and aerosols at 1-2km resolution globally, using satellite data and proprietary AI/ML algorithms. This data is used to drive irradiance models, enabling Solcast to calculate irradiance at high resolution, with typical bias of less than 2%, and also cloud-tracking forecasts. This data is used by more than 350 companies managing over 300 GW of solar assets globally.
The views and opinions expressed in this article are the author’s own, and do not necessarily reflect those held by pv magazine.
This content is protected by copyright and may not be reused. If you want to cooperate with us and would like to reuse some of our content, please contact: editors@pv-magazine.com.


By submitting this form you agree to pv magazine using your data for the purposes of publishing your comment.
Your personal data will only be disclosed or otherwise transmitted to third parties for the purposes of spam filtering or if this is necessary for technical maintenance of the website. Any other transfer to third parties will not take place unless this is justified on the basis of applicable data protection regulations or if pv magazine is legally obliged to do so.
You may revoke this consent at any time with effect for the future, in which case your personal data will be deleted immediately. Otherwise, your data will be deleted if pv magazine has processed your request or the purpose of data storage is fulfilled.
Further information on data privacy can be found in our Data Protection Policy.