For a long time, engineers have contented themselves with setting strict degradation and unavailability numbers, often guided by an independent engineer’s recommendation, and handed those assumptions off to the finance team. I say no longer!
The designer and engineer of the solar array should own all of the energy numbers for the lifetime of the system. Why you ask? Because overlooking nuanced degradation and unavailability can lead to underestimation of project returns and challenges in securing financing. We are finding that 0.5% degradation is no longer a good standard for system degradation and that unavailability is highly variable year-to-year. By utilizing the data within the 8760 (energy) file you can not only take the best assumptions given by the independent engineer but also get more production for your finance team to use! Seems too good to be true? It is not, and here is why.
Let’s start with degradation. Everyone knows that the performance of modules degrades over time. The process of continually cycling through heating by the sun and cooling results in the layers of the module slightly separating over time. An interesting fact is that modules are really the only part of the system that degrades. Wiring is constant and racking is designed for the whole system life. Inverters and Transformers have set efficiencies that do not decrease.
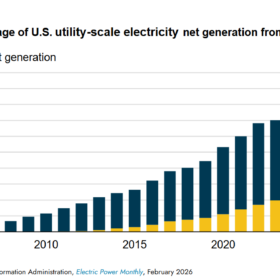
Therefore, we should look to modules to calculate degradation. In a DNV white paper, the best standard for linear module degradation is 0.64%. What we would typically do now as an engineer is to tell our finance team, “…here is the 8760 and we should use 0.64% as degradation year-year.” Stop right there! Let’s rethink this for a second. If the degradation is coming from the DC side of the system, and the finance team is taking the AC power output and degrading it, are we treating the degradation properly? The industry consistently designs systems with a high DC/AC ratio, and with that comes inverter clipping. Degrading the entire system allows production to be lost as it degrades the clipped AC power out and not the DC power flowing into the inverter. The chart below shows a sample of the difference between Y1 and Y10 of summer day for a solar array. One with degradation applied to the AC and one to the DC.
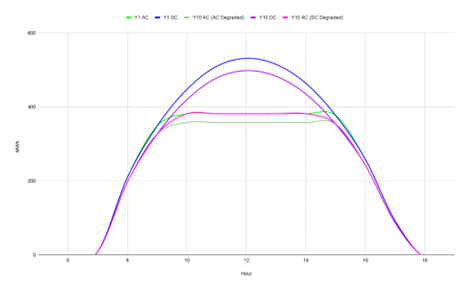
You can see clearly that, when the Y1 AC values are degraded (shown in Y10 AC (AC Degraded)), the system is shown to produce significantly less energy than when Y1 DC values are degraded and clipping is applied (shown in Y10 AC (DC Degraded)). In this example day, 3.8% less energy is shown to be generated through traditional methods. Every instance where your 8760 has a clipped value and you pass it to your finance team, you are losing production data that should be captured in the model. Therefore, the solar professional that is generating the 8760 should simultaneously generate multiple years with the proper degradation rate. Solesca has this methodology baked-in to our lifetime monthly energy numbers, so you do not need to do the tedious calculations yourself for each year.
Now it is time for unavailability, everybody’s favorite boogeyman. For too long have we assumed constant unavailability across every year of the project, no matter the size and system type. For too long have we not taken into consideration the first few operating years, inverter replacement, and preventative maintenance. No more!
Based on a webinar and data from three different providers, DNV has updated guidance for unavailability estimates. In the webinar, DNV presents 10 years’ worth of real operating data with availability. They also give recommendations for systems greater than 10 MW and Single Axis Tracker (SAT) racking type. Let us start with the base model, a system with a capacity of up to 10 MW. In the DNV presented data, the first year has increased unavailability due to the commissioning and startup considerations. Then it plateaus until decreasing at years 8 and 9. This is due to inverters starting to reach their end of life and failing, with increased unavailability to handle their downtime and replacement. Secondly, an increase across the board of 0.5% unavailability for systems over 10 MW is observed. Lastly, an increase of 0.5% in unavailability for SAT systems is recommended due to tracker downtime.
Synthesizing the information learned in this webinar we can uncover a better way of handling system unavailability. We can use the base model DNV presented, add the additional unavailability for the systems over 10 MW or that are SAT, and have good projections for the first 10 years of the system. But what about the other 15 to 25 years? There is no substantial available data to discern this question, so we must rely on logic. If the unavailability increases due to inverter downtime at year 9, is it not logical that this would subsequently decrease once the inverters are replaced? This assumption is crucial to how Solesca handles assumed unavailability.
We take those initial 10 years and assume that unavailability resets once you fully replace the inverters for the lifetime of those inverters. This is assumed to happen at years 12 and 25 but can be changed to suit your assumptions. The unavailability decreases after the inverter replacement to then increases as those new inverters reach their end of life. Lastly, as the system ages, we assume that there will be more general downtime through issues like ground faults, blown fuses, broken modules, etc. Solesca attempts to take into account the O&M struggles as arrays reach maturity by adding another 0.5% unavailability for years 25 or more. While the data is limited, this assumption aligns with typical operational experience in aging solar assets.
By implementing both more accurate degradation and unavailability estimates based on current data from the respected independent engineer the solar designer can project energy into the future in a more accurate manner than before. Degrading the DC side of the system leads to significantly more energy for systems with a DC/AC ratio higher than 1 as the years increase. Accounting for yearly unavailability leads to a more realistic view of each year as you account for your assumptions and mold them to published data.
The ways of having the finance team handle any energy calculations should go the way of the dodo bird. Doing both the degradation and unavailability for each year the proper way is a difficult undertaking. As the paradigm shifts of engineers handling 8760 and finance handles the rest, Solesca is offering our Lifetime Energy model. In it, we handle both degradation and unavailability described above. We also include an added day of production for leap years. By using this method we find system generation improvements over the lifetime of the array of up to 1% relative to the standard model. This leads to increased accuracy, potentially better financing numbers, and a more realistic view of project performance. We aim to be at the forefront of ushering in this shift in process.
Ongoing data collection and industry collaboration will be crucial to further refine long-term unavailability assumptions in the future. Engineers have a key role to play in this evolution, ensuring more accurate and reliable energy predictions for solar projects.
Solesca Energy, Inc. offers pre-CAD software for C&I and ground-mount solar. It has helped evaluate over 100GW of projects with unmatched accuracy and speed.
The views and opinions expressed in this article are the author’s own, and do not necessarily reflect those held by pv magazine.
This content is protected by copyright and may not be reused. If you want to cooperate with us and would like to reuse some of our content, please contact: editors@pv-magazine.com.


By submitting this form you agree to pv magazine using your data for the purposes of publishing your comment.
Your personal data will only be disclosed or otherwise transmitted to third parties for the purposes of spam filtering or if this is necessary for technical maintenance of the website. Any other transfer to third parties will not take place unless this is justified on the basis of applicable data protection regulations or if pv magazine is legally obliged to do so.
You may revoke this consent at any time with effect for the future, in which case your personal data will be deleted immediately. Otherwise, your data will be deleted if pv magazine has processed your request or the purpose of data storage is fulfilled.
Further information on data privacy can be found in our Data Protection Policy.