
Software, drone and robotics analytics firm Raptor Maps said global annualized losses for solar asset underperformance reached up to $10 billion in 2024.
The company said that while the growth in underperformance slowed down year-over-year, increasing 15%, the average solar facility in its database averaged $5,720 per MW in annualized losses. This is up from an average of $977 per MW in 2020.
The company’s report draws on analysis of 193 GW of utility-scale, commercial and industrial projects, with 67 GW of projects analyzed in 2024. This is a sample of the roughly 2 TW of global solar capacity installed cumulatively worldwide.
Underperformance was attributed to equipment-driven issues, increased risk profiles due to extreme weather, ongoing labor constraints and political headwinds.
Power losses have increased considerably since 2020, climbing from 1.84% to 5.77%, the company stated in its annual report. For context, a 100 MW site experiencing 5.77% underperformance from year two of operations until decommissioning would see its project internal rate of return drop by 249 basis points, according to Raptor Maps.
At an equipment level, the largest power losses were attributed to inverters (2.13%), strings (circuit/string problems not located in the inverter) (1.26%) and combiners (1.04%). Tracker issues and module-level issues followed as leading contributors to power losses. The most common power loss issue for modules were malfunctions at the cell level.
Another issue highlighted was the growing gap between solar deployment and operational labor. Cumulative solar capacity increased 182% from 2018 through 2023, but U.S. employment in operations and maintenance increased 91% over that time, according to data from IREC.
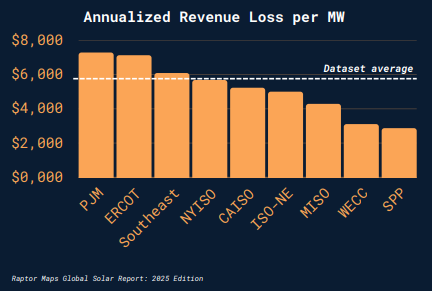
Power loss averages ranged widely by regional markets, with ERCOT and PJM regions exceeding an average of $7,100 per MW, as seen below.
Across the U.S., inverters were the leading equipment cause of power losses (39%), followed by strings (22%), and combiners (19%). In the ERCOT and MISO markets, over 50% of power losses were attributable to inverter issues.
Extreme weather risks varied widely by region. Raptor Maps said ERCOT assets were 16 times more likely to be damaged by weather events than those in the New York ISO region. The Texas ERCOT region is particularly exposed to threats from hail damage, as well as being vulnerable to hurricanes. Assets in the Southeast had weather damage risks 6.5 times greater than NYISO.
‘With global capacity surpassing 2 terawatts (TW) just two years after reaching 1 TW, leading players are now embracing automation, software-driven diagnostics, and robotics to combat operational challenges and ensure long-term cost competitiveness,” said the report.
This content is protected by copyright and may not be reused. If you want to cooperate with us and would like to reuse some of our content, please contact: editors@pv-magazine.com.


Interesting update and appreciated their previous reports. Also matches what we’ve observed here in Ontario https://boxbrite.com/ontario-solar-pv-om-benchmark-study/
I think sharing this type of data more widely should improve results in the long term. That’s been our experience in working with customers. Once you show them the financial implications of neglecting O&M you see a change. I like to say “what you measure counts”.
yo tengo un sistema de celdas solares donde en climas donde cae nieve estos paneles descongelan automaticamente la nieve y los paneles son mas eficientes sin nieve.
Why would the losses be shown in $/MW? How is that a helpful metric for people in the solar industry? It doesn’t say anything about % of underperformance or MWh underperformance.
I am surprised that tracker losses aren’t greater than inverter losses. I think one challenge is identifying and calculating tracker losses. Many Independent Engineering organization started providing different unavailability for SAT’s vs fixed systems.