Carbon intensity, or the amount of emissions per unit of energy, of power generation in the United States has fallen 18% nationwide from 2016 to 2020. As the nation has shifted the generation mix away from coal and towards renewable energy and natural gas, emissions have come down considerably, though there is a wide variance among the states.
The Energy Information Administration (EIA) tracks carbon intensity data, and found that in 2020, the nationwide average was 854 lbs. of carbon dioxide per megawatt-hour of electricity generated. Coal averaged 2,274 lbs. of CO2/MWh, while natural gas averaged 980 lbs. of CO2/MWh. Nuclear power plants and non-emitting renewables, such as hydroelectric, wind, and solar power, produce little to no CO2 emissions.
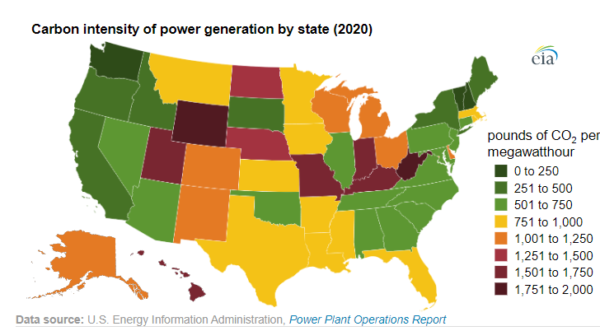
The EIA map above provides an outlook into opportunities for development. States like Utah, Colorado, and New Mexico have relatively high carbon intensity, but also high levels of solar irradiance, making them attractive areas for solar development. Northern states with high carbon intensity like North Dakota, Wyoming, and Nebraska overlap with the United States wind belt, highlighting the opportunity for wind energy development.
Despite wide variances in carbon intensity by state, 43 states and the District of Columbia recorded lower carbon intensity of power generation in 2020 relative to 2016. Wyoming ranked as the most carbon-intensive energy generator in 2020 with an average emissions of 1,970.8 lbs. of CO2/MWh. The state generated 79% of its power from coal.
Notably, the EIA report on carbon intensity is based on the power generated in the state, but not necessarily what was used. States purchase out-of-state generation and sell it to other states. In 2020, Vermont had the lowest carbon intensity of power generation at 8.4 lbs. of CO2/MWh, close to zero emissions. Almost all of Vermont’s in-state electricity generation came from renewables, and Vermont brings in about 60% of its electricity from Canada.
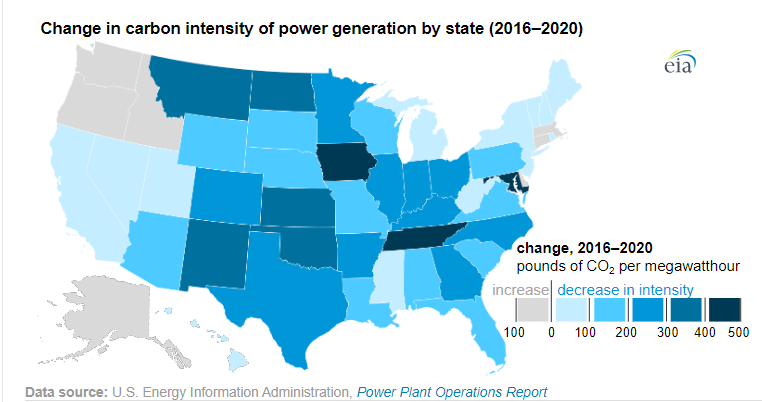
From 2016 to 2020, the five states with the largest reductions in carbon intensity were:
- Tennessee (by 486 lbs. of CO2/MWh)
- Maryland (by 477 lbs. of CO2/MWh)
- Iowa (by 443 lbs. of CO2/MWh)
- Kansas (by 371 lbs. of CO2/MWh)
- Oklahoma (by 348 lbs. of CO2/MWh)
Tennessee benefitted from the retirement of coal plants and an increase in nuclear and solar over the four-year span. It had a large boom in solar from 2016 to 2019, though in recent years deployment has slowed. In Maryland, coal’s share decreased from 37% to 9%. Iowa, Kansas, and Oklahoma all relied on wind energy to displace retiring coal plants.
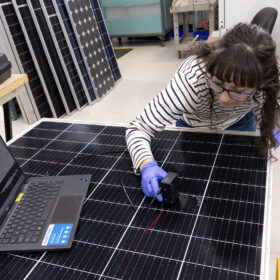
Another important part of decarbonization efforts is recognizing the carbon “backpack” of a given energy source, which is the amount of carbon that was emitted to create that energy-producing component. For example, a solar panel manufactured in a region that uses heavy amounts of coal to power its factory would have a much different carbon backpack than one that was built using a cleaner energy source.
(Read: “Energy output is over 100 times the input needed to manufacture solar panels“)
The Ultra Low Carbon Solar Alliance is an organization that is focused on bringing attention to these differences in energy production. The Alliance consists of companies across the solar PV value chain and other stakeholders committed to expanded market awareness and deployment of ultra low-carbon PV to accelerate reductions in solar supply chain GHG emissions.
This content is protected by copyright and may not be reused. If you want to cooperate with us and would like to reuse some of our content, please contact: editors@pv-magazine.com.


By submitting this form you agree to pv magazine using your data for the purposes of publishing your comment.
Your personal data will only be disclosed or otherwise transmitted to third parties for the purposes of spam filtering or if this is necessary for technical maintenance of the website. Any other transfer to third parties will not take place unless this is justified on the basis of applicable data protection regulations or if pv magazine is legally obliged to do so.
You may revoke this consent at any time with effect for the future, in which case your personal data will be deleted immediately. Otherwise, your data will be deleted if pv magazine has processed your request or the purpose of data storage is fulfilled.
Further information on data privacy can be found in our Data Protection Policy.