A decade ago, resources for scouting viable locations for new distributed energy resources (DER) simply did not exist.
That meant solar developers had zero access to critical power grid connection information, substation status, and other local solar plant connections. We were flying blind.
In practice, this is how it worked from a solar sales perspective:
1. Find a viable business owner interested in solar
2. Owner signs deal, $2,5000 payment made for PE-stamped one line & interconnection application
3. Developer submits the interconnection request…and hopes for the best.
The risks could be mitigated somewhat by knowing the power grid well, or by tracking down an insider willing to answer specific questions. However, the developers’ obligation to take on power grid risk slowed efficient markets from forming.
Since then, multiple states have created legal requirements forcing electric monopolies to share their power grid data with solar developers via what are known as Hosting Capacity Analysis (HCA) maps. States that now provide HCA maps include California, Connecticut, Maryland, Massachusetts, New York, Rhode Island, and Vermont.
More recently, the Interstate Renewable Energy Council and the Clean Coalition of California have made large contributions to the maps.
With the evolution of these HCA maps, developers now have access to something that previously was elusive: useful data. As outlined in an earlier pv magazine USA article, these still-young hosting capacity maps haven’t always shown the most accurate information, meaning that solar developers might not have reached out to customers in these regions.
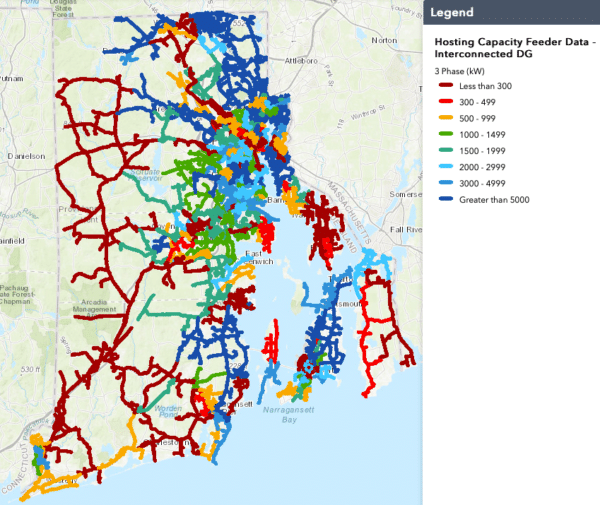
Rhode Island HCA maps
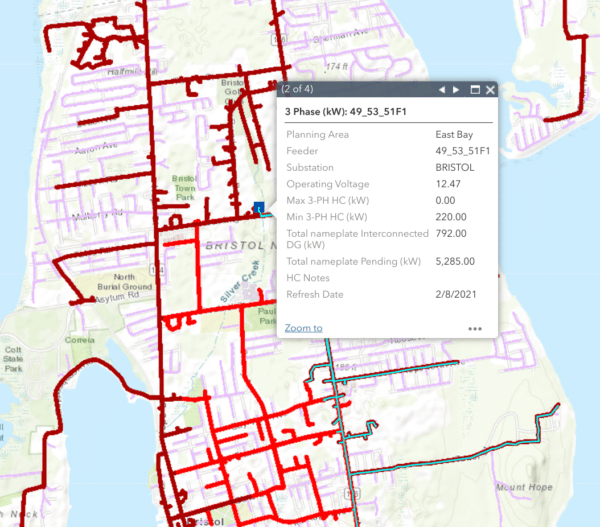
Utility National Grid operates in Rhode Island and illustrates local line capacities with its HCA map. Surplus availability for solar capacity — always listed in AC/inverter sizing terms — is determined by the utility and based on the minutia inherent to each circuit. The highest capacity locations are seen in dark blue.

Additional information includes total solar already on the circuit, the circuit’s voltage, whether the circuit is three phase or single phase, and a range of substation bank information.
Each utility has a set of rules and disclaimers governing the information they release, and what that information represents on their maps. Adding complexity, there’s still the human factor involved, because the numbers aren’t entirely accurate in all places; think of them as a guide.
For example, a recent 200 kWac project in Rhode Island learned when the interconnection application was submitted that no additional solar power was on either the local circuit or at the substation.
But by the time the project’s interconnection was returned, a 5 MWac solar project had won approval at the substation. As a result, the smaller 200 kWac project was told that the substation was full, and that it would have to share a roughly $650,000 upgrade cost, potentially delaying the project until the upgrades were complete.

As it turned out, the larger-scale ground mount project was moving slowly due to local resistance. Without offering an explanation, when the final interconnection for the 200 kW project was approved, the utility assessed no new fees.
As of today, that big solar power plant is still pending, but the small one is complete.
Properly designed, the hosting capacity maps offer the ability to look closely at our power grid resources.
Southern California Edison’s hosting maps contain a built-in function enabling users to filter sites based on available capacity above a certain threshold. As a solar developer and individual cheering for a strong power grid, few pieces of data are as useful as site data sorted by grid demand.
Knowing exactly what circuits can handle – and which circuits are arguably in need of solar power – is like a treasure map.
Here are links to several Hosting Capacity Maps intended for solar developers. If you have more to contribute, please comment with a link.
- Massachusetts (links about halfway down the page)
- Rhode Island
- New York
- GMP in Vermont
- Minnesota
- First Energy in New Jersey
- PEPCO in New Jersey
- PSEG in New Jersey
This content is protected by copyright and may not be reused. If you want to cooperate with us and would like to reuse some of our content, please contact: editors@pv-magazine.com.


As the Virginia Clean Economy Act passed last year, Dominion has a similar map now. These tools make it so every stakeholder in the process is able to work more efficiently and save the entire system precious time + money. Really hope utilities and leaders are thoughtful about more consistent updates to these portals (live data, in an ideal world) to improve results across the board.
Link for New York is broken