“Since 2010, the cost of energy has dropped by 82% for photovoltaic solar, by 47% for concentrated solar energy (CSP), by 39% for onshore wind and by 29% for wind offshore.”
Those remarkable price drops are quoted by the International Renewable Energy Agency (Irena) in its Renewable Power Generation Costs in 2019 report.
The figures were compiled from the costs and tariffs reported for 17,000 renewable energy project tenders last year which should eventually add up to 1.7 GW of clean power generation capacity.
The cost reductions witnessed in the last decade were due to improved technology, economies of scale, supply chain competitiveness and the growing experience of developers, said Irena.
“The same amount of money invested in renewable energy is producing far more new capacity today than it was ten years ago,” stated the multilateral organization. In 2010, the 88 GW of renewables capacity installed worldwide required the equivalent of $210 billion. Last year, twice that capacity volume was put into service for $253 billion – around 20% more investment.
Solar
Between 2010 and 2019, the amount of global solar capacity rose from 40 GW to 580 GW, according to Irena – a growth factor of 14. During the same period, module prices fell 90% and balance of system (BoS) costs also decreased, if less steeply.
The current levelized cost of energy (LCOE) for large scale solar is $0.068/kWh, compared to $0.378 in 2010 — and the cost fell 13.1% between 2018 and last year alone, according to the Irena report.
The nationally-weighted average cost of electricity from large scale solar fell 85% in India during that period, according to Irena. Other notable falls included China, Italy and South Korea, where the solar electricity price retreated 82%, as well as Spain (81%), Australia (78%), France (77%), Germany (73%) and the U.S. (66%). Emerging markets, too, have benefited from price falls. Vietnam, for instance has seen the solar energy cost fall 55% since 2016.
The Irena report also points out the cost – per kilowatt installed – of large scale solar projects dipped below $1,000 for the first time last year, to $995, a figure 18% smaller than that of 2018 and 79% cheaper than project costs a decade ago.
Rooftop PV
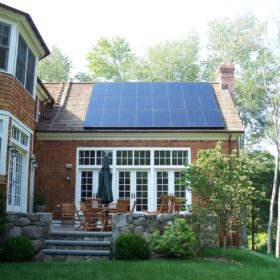
Residential solar costs, states the report, fell 47% to 80% between 2010 and last year, depending on the region.
“New projects to produce energy from renewable sources are less and less expensive today compared to existing coal-fired power plants,” stated the Irena study. “On average, it’s cheaper to commission new PV and wind power facilities than to keep many coal-fired plants in operation.”
Almost 56% of the large scale renewable energy plants commissioned last year produce electricity cheaper than the lowest-cost fossil fuel alternatives.
The picture was radically different in 2010, according to Irena, which said solar electricity from large scale projects at that point was 7.6 times more costly than from fossil fuel facilities.
“Next year, it could be more expensive to operate 1,200 GW of existing capacity in coal-fired power plants than putting new solar photovoltaic installations into service on an industrial scale,” said the renewables body, adding the maintenance or installation of new coal-fired power plants is not economically viable.
Procurement
Although the Covid-19 pandemic is expected to slow the rate of solar and wind deployment this year, the public health crisis shows no sign of being able to slow the cost reduction trajectory of renewables, according to Irena.
The most recent tenders and power purchase agreements (PPAs) indicate the price of solar electricity could average $0.039/kWh for projects commissioned next year. That would represent a fall of 42% from last year and would correspond to a fifth of the cost of the cheapest fossil fuel electricity – which is still that generated by coal-fired power plants.
“The record figures reached by the auction of solar photovoltaic electricity in Abu Dhabi and Dubai (UAE), Chile, Ethiopia, Mexico, Peru and Saudi Arabia confirm that values of only $0.03/kWh are already possible,” added Irena.
This content is protected by copyright and may not be reused. If you want to cooperate with us and would like to reuse some of our content, please contact: editors@pv-magazine.com.


Thanks for the information. What are the other figures on top of the PPA’s? One I can think of is delivery cost of the electricity.
Bill Gordon
““The same amount of money invested in renewable energy is producing far more new capacity today than it was ten years ago,” stated the multilateral organization. In 2010, the 88 GW of renewables capacity installed worldwide required the equivalent of $210 billion. Last year, twice that capacity volume was put into service for $253 billion – around 20% more investment.””
At utility scale there are other cost “savings”, manufacturing runs of 10s of thousands to 100s of thousands of solar PV panels has the power of economies of scale, the larger the project the less each panel costs in $/watt. Energy storage as part of the project allows time shifting energy generation and creates a longer day of generation service to the grid than the number of “sun hours” in the day. Energy storage can also be used as a stacked grid services asset, which pays for the ESS in ancillary grid revenues.
It is still more efficient to have the solar PV installed on the roof of the home or business that will use the generated power. As prices go down for solar PV an example, in 2005 a top of the line solar PV panel of 200 watts output was retail $1,100 per panel or $5.50/watt. Today you can find premium solar PV panels in the 330 watt range at $0.80/watt or $264 per panel, there are some solar PV panels in this power range that are being sold online for $225 per panel. More power harvest, less money, more money available to overdesign a system for decades of service with little or no penalty.