We look at the past to help us prepare for the future. We study the patterns not only to attempt to predict where things are going, but to inform what actions we need to take to achieve certain outcomes.
This is particularly true of renewable energy. The U.S. solar market has grown year-over-year in eight of the past 10 years, and every year the capacity of solar on the grid and its contribution to our electricity system has grown.
And yet, after a decade of this rapid growth solar only contributed 2.4% of the electricity supply in the United States in 2018. When you add wind, the total was nearly 9%, but we will have to increase that many times over by 2030 if solar and wind are to supplant fossil fuels and decarbonize the electric grid to the degree that scientists say is necessary to keep global average temperature increases below 2 degrees Celsius.
It is natural here to ask how fast solar (and wind) – and their contribution to the electric grid – are growing. But an even more important question is what the pattern of this growth is. In this article I focus on solar, as wind has a different pattern in the United States.
Linear vs. exponential growth
Here two concepts are key: linear and exponential growth. In linear growth, a number increases by the same portion over time, as shown in the pattern: 2,3,4,5,6. In exponential growth, the number increases as a multiple of the previous number, as shown in the pattern: 2,4,8,16,32.
When talking about the contribution of renewable energy to the electric grid, there are a few key facts to keep in mind. As the capacity factor of solar is relatively stable from year to year, the volume of electricity it generates is fairly directly related to how much is installed – as long as you are installing it in (roughly) the same places. And as electricity demand is flat to declining in the United States the increase in the generation corresponds roughly to the portion of demand met.
Therefore if you double the amount of solar on the grid, you (roughly) double the electricity generation from solar, and you (roughly) double the portion of demand it meets. If you do this year after year, or even every two years, that is exponential growth.
Another important point is that growth of the market is not the same as growth of cumulatively installed capacity. If the same amount of solar were installed every year, with no market growth from year to year (flat growth), cumulative capacity – and electricity generation – would grow on a linear basis (1,2,3,4,5). But if the market grows every year, then the cumulative capacity and the electricity generated are not growing on a linear basis. They are growing faster than that.
In fact, they could be growing exponentially.
Exponential, or accelerating growth?
When pv magazine conducted its most recent long-term analysis of the increase in generation from solar and the portion of U.S. electricity demand that it met, we found that it had gone from 2 TWh to 96 TWh from 2008 to 2019 – a 48x increase over 11 years. Another way to look at this is that it was doubling roughly every two years.
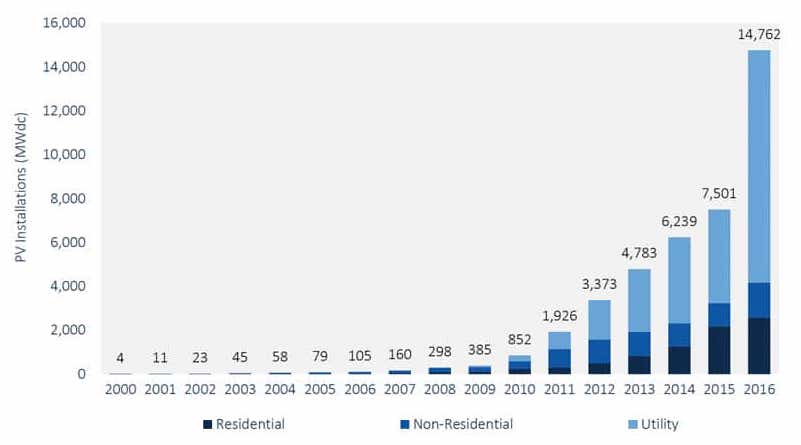
This is exponential growth. But a deeper look at the numbers has us questioning what is going on. Data collected by Wood Mackenzie and Solar Energy Industries Association (SEIA) shows only around 385 MW of solar being installed in 2009, which rises to 7.5 GW in 2015. The market is clearly growing from year to year – in fact, from 2009 to 2010 it more than doubles, and more than doubles again from 2010 to 2011. But from 2011 through 2015, the market increases by the same amount – around 1.3 GW each year.
This means that cumulative capacity was growing, and was growing by an increasing amount every year. But this was not enough for exponential growth in installed capacity, because the market would have to be growing every year by an increasing amount for that to happen. Instead, while the cumulative capacity was growing every year, it was growing at a decreasing percentage over the previous year.
We at pv magazine are not sure of the exact mathematical term for this, but on the advice of Kees van der Leun of Navigant Consulting, we are calling this “accelerating” growth. And it appears that for the longest period in the past decade where we had relatively stable policy in the United States, growth of cumulative installed capacity was accelerating, but not exponential.
So for now, we at pv magazine are describing the growth in capacity/generation as “accelerating”, because of the clear pattern from 2011 to 2015. Also if given a choice of otherwise equally valid descriptions, we’re going to go with the one that is most easily supported. But whether you decide that installed solar capacity in the United States and its contribution to the electricity system are growing at an exponential or accelerating rate is really dependent on which date range you look at.
Policy matters
You may have noticed by now that we are not looking at the years 2016 through 2018, despite having data for these years. The reason for this is the markets during these years were strongly affected by national policy, in ways that we have covered exhaustively at pv magazine.
In 2016, the pending step-down of the federal Investment Tax Credit (ITC) drove a massive boom in project construction, leading to another doubling of the market – from 7.5 GW in 2015 to around 16 GW in 2016. This led to something of a “hangover” in 2017, with only around 10 GW installed. And in 2018, the process of imposing Section 201 tariffs on cells and modules at a minimum delayed large-scale project development for six months, and also caused some projects to never get built – meaning another 10 GW year.
As such, these years simply aren’t good indicators of long-term trends. But they do illustrate an essential point: solar deployment is strongly affected by policy and policy changes. In all of those years from 2009 through 2015, policy was also affecting the market – not only the 30% ITC, but also state-level renewable energy mandates, the availability (or not) of net metering, state and local incentives – even the structure of electric rates.
Looking to the future
If we are serious about decarbonizing the electricity system using solar and wind, it is important for policymakers, advocates and the solar industry to understand where the market is going. In other words, it is important to understand not only the rate of growth of the solar industry but also the nature of this growth – whether it is linear, accelerating or exponential.
If we overestimate the nature of growth – such as assuming exponential growth where it does not exist – there is a danger that we won’t implement the necessary policies to do what it takes to rapidly decarbonize. But if we underestimate the nature of growth – such as describing it as linear when it is accelerating or exponential – then we not only undermine reasonable expectations, but we are in danger of creating a self-fulfilling prophecy, as warned by the World Economic Forum in a recent report.
The data clearly shows that “hangover” years and tariffs aside, the installed base of solar in the United States is at least accelerating, if not growing at an exponential rate. As such, we should expect it to get larger in the future. That means that while it has taken a decade for solar to go from 0.1% to 2.4% of the electricity system, we shouldn’t expect it to grow an average of .23% per year for the next decade (assuming no major policy changes).
From 2017 to 2018 the portion of U.S. generation from solar grew roughly 0.5%. We should expect it to grow more than this in the future, every year. And while some may point to the phase-out of the ITC, there are many counterbalancing factors, including the increase in state-level renewable energy and clean energy mandates, the emergence of large-scale solar markets in the U.S. South, Texas, Florida and the Midwest, and the truly awesome amount of projects being planned.
However, it is also important to note that even if solar grows at an accelerating or even exponential rate every year, this does not mean that it will necessarily reach the levels needed to decarbonize our electricity system by 2030. If the portion of solar on the grid doubles every four years instead of two (still exponential growth, but slower than 2009-2018), we’ll still only be getting around 18-19% of our electricity from solar by 2030.
That is considered “ambitious” by the standards of the Solar Energy Industries Association (SEIA), but the youth of this world are rightfully demanding more than that.
The electricity sector is highly regulated and there is no free market here. Solar will continue to need a fair policy environment, but what it takes to keep deployment strong changes over time as prices fall, capital gets more comfortable with solar and developers and off-takers gain experience.
But to start, we need to be clear about what it is that we are seeing.
The views and opinions expressed in this article are the author’s own, and do not necessarily reflect those held by pv magazine.
This content is protected by copyright and may not be reused. If you want to cooperate with us and would like to reuse some of our content, please contact: editors@pv-magazine.com.


Good article.
(Small, but significant typo “from 750 MW in 2015 to around 16 GW in 2016” should be 7501MW in 2015 or to keep consistent units 7.5GW.
Thanks!
“And yet, after a decade of this rapid growth solar only contributed 2.4% of the electricity supply in the United States in 2018.”
Interesting, that at that point of (only) 2.4% averaged across the U.S., the power companies are crying “duck curves”, “curtailment”, “lost revenues”, “stranded assets”, time and again. Folks aren’t stupid, they see the fallacy of the electric utility for what it is, an entitled whiner that can’t figure out how to run a grid system that would be bi-directional instead of fueled generation uni-directional. Duke, Sempra, Pinnacle, NRG Energy and the sundry ISOs, we have to curtail and waste energy, because (we) can’t handle a non-fueled distributed grid infrastructure, Waaahhhhhh, waaaahhhhhh, waaaaaaahhhhhhhh, call a Whambulance.
Well, to be fair, it is more like 17% in California as of the first half of 2019. Some regions have deployed far more solar than others, and in those areas there are real challenges to integration and needs for market reform.
But the claims of a “cost shift” are mostly disingenuous.