In the six months since the implementation of the section 201 tariffs, Americans have seen a $236.5 million tax on installing solar, according to EnergySage’s most recent Solar Marketplace Intel Report, which covers trends in the market from the second half of 2107 to the first half of 2018.
It’s worth note that this data is not definitive of the overall residential solar market. EnergySage uses the data collected from its marketplace, which notably does not include larger companies who choose not to participate like Tesla, Sunrun, Vivint and Sungevity – although some Sunrun dealers are featured on the site. However, the report is a key insight into the market of small-to-mid sized installers.
The report outlines that the $236 million tax on solar is a reflection of both the section 201 tariffs and the U.S. International Trade Commission’s (USITC’s) finding of injury to U.S. solar manufacturers in September 2017. In the two months following the ruling, EnergySage found in their marketplace a $0.07 spike in the average cost-per-watt of a residential system. And, while there has been a decline total solar costs since that peak point in November at 0.5% per month, it has been much slower than the anticipated pre-ruling decline.
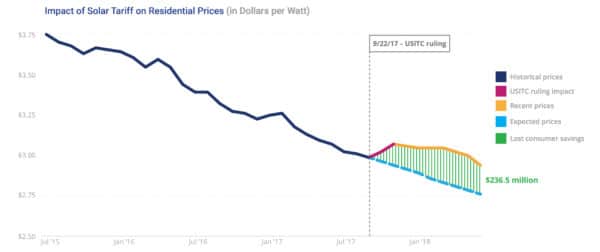
EnergySage found that customers during this half-year period saw installation prices 5.6% higher on average than they would have expected without the tariffs and USITC decision. This works out to a $0.16 per-watt increase for the average customer over this time, which, when applied to the typical 6kW residential system, becomes a $960 tax on new residential solar systems.
“Any trade restrictions imposed on the solar industry hurts American consumers and American workers,” said EnergySage CEO and founder Vikram Aggarwal of the report. “Yet despite these recent hurdles, the residential solar industry remains poised for tremendous growth over the next few years. All-time highs in consumer interest for solar-plus-storage, combined with falling prices and greater transparency, has mitigated the impact these tariffs can have.”
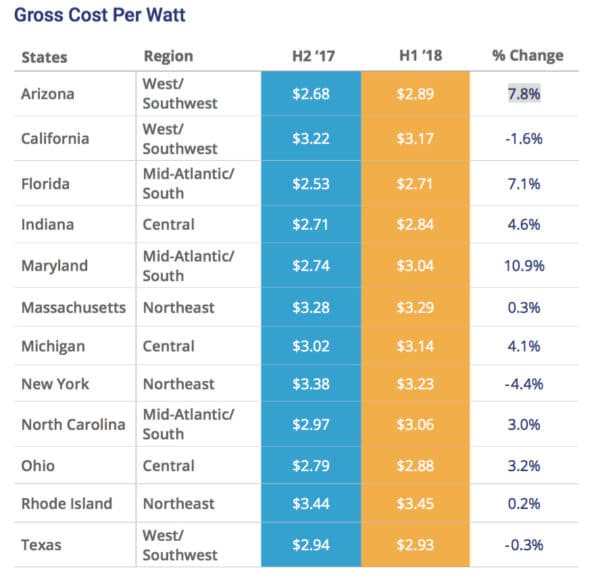
These cost-per watt increases for quoted price of a new solar system were also felt at the state level. Of the 12 states that EnergySage tracked the data of, 9 of them – Arizona, Florida, Indiana, Maryland, Massachusetts, Michigan, North Carolina, Ohio and Rhode Island – saw increases in the overall price-per-watt of a project, while only California, New York and Texas saw a decrease. The Mid-Atlantic/South as a region saw the highest per-watt increase in price, at an average of 7%. While the West/Southwest did see an average state increase of just under $0.02 per-watt, this number was skewed heavily by Arizona’s 7.8% increase, the second highest in reported states, as both California and Texas experienced decreases.
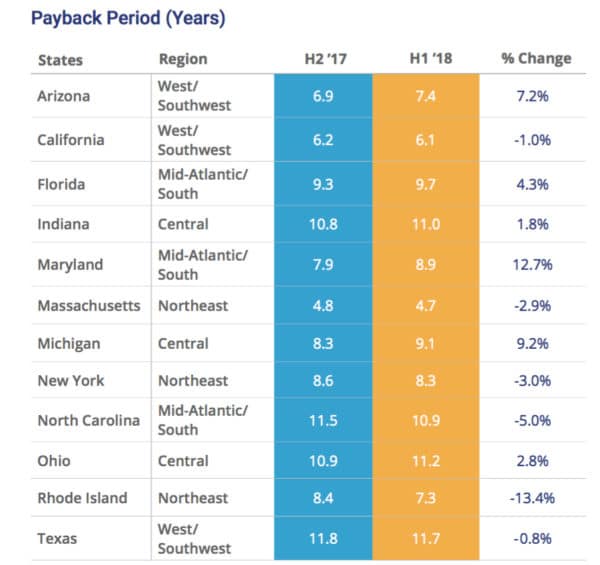
However, as states saw an increase in the per-watt quoted price of solar systems, that didn’t necessarily mean that they also saw increases in the overall estimated time of payback for these systems. This distinction was split 50/50 with Arizona, Florida, Indiana, Maryland, Michigan and Ohio seeing increases, while California, Massachusetts, New York, North Carolina, Rhode Island and Texas saw decreases. New York, California and Texas were the only states to see decreases in both the per-watt price quote average and payback period average, while Arizona, Florida, Indiana, Maryland, Michigan and Ohio saw increases in both. The average payback period for the reported states is 8.9 years, which, coincidentally is the same figure as Maryland’s average. Texas, while down 0.8%, still had the highest payback period at 11.7 years, while Massachusetts had the lowest at 4.7 years. The biggest shifts were Maryland’s 12.7% increase and Rhode Island’s 13.4% decrease.
This content is protected by copyright and may not be reused. If you want to cooperate with us and would like to reuse some of our content, please contact: editors@pv-magazine.com.


I wonder if the tariffs imposed on imported panels from China exceeds the tax credit incentives given to people that install solar?
Probably not. The 30% federal Investment Tax Credit (ITC) applies to the whole system, the 30% tariff is just on the panels, which are a small portion of overall system costs. Of course, you have to be able to monetize the ITC… and if you can’t, you have to make a deal with someone who can. Which means you don’t get the whole benefit.
However, the ITC is phasing out after the end of next year. For large-scale installations I see it as having fulfilled its purpose.