We at pv magazine USA have not been the biggest fans of the U.S. Federal Energy Regulatory Commission’s (FERC) monthly Energy Infrastructure Update. There are multiple reasons why we feel the report falls short.
To start with, it does not include “behind-the-meter” distributed solar, and as such misses a significant portion of the U.S. market. And over the years its count of utility-scale solar has often fallen well below what is reported by GTM Research and Solar Energy Industries Association (SEIA) in their quarterly U.S. Solar Market Insight reports. This is true even when the use of AC figures by FERC and DC by GTM Research and SEIA are accounted for.
Our staff has also found months where the total installed utility-scale solar capacity estimated by FERC has been smaller than individual projects which we have observed coming online in a given month.
No data source is perfect, but we have gotten the impression that FERC and its contractors simply do not track U.S. solar installations in the kind of comprehensive way that private actors, such as GTM Research and SEIA, do.
That being said, we do trust FERC to track installations of conventional power plants, as they have been doing this for much longer. And if you look at the numbers in the organization’s Energy Infrastructure Update for March 2018, the trend is clear.
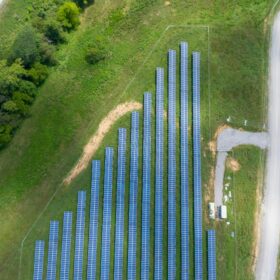
According to the document, in the first three months of the year, 16 wind farms totaling 1.79 GW-AC represented 53% of the new capacity coming online, and 92 solar projects with a combined capacity of 1.36 GW represented another 40%. With rounding, 94% of new utility-scale capacity installed was wind and solar.

Again, as this does not include distributed generation, it is safe to conclude that the actual portion is higher.
New gas plants on the decline
Natural gas, which has dominated new projects in the 21st century so far, barely made a showing. The 6 new units put online in the first three months of 2018 totaled only 79 MW-AC – as opposed to 28 units representing 2.25 GW in the first quarter of 2017.
There can be significant variations in installation levels of any resource from quarter to quarter. However, this follows an 8% decline in electricity generation from gas in 2017 (table 1.7.B), the first annual decline in the United States since 2013.
It also comes as California is increasingly choosing a combination of renewable energy, energy storage and other non-fossil resources to replace not only new gas plants, but increasingly over existing fossil fuel generation.
All of these trends stands in sharp contrast to plans by utilities DTE Energy (in Michigan) and Entergy New Orleans to build gas plants in their service areas, decisions which have been enabled by regulators which do not appear to be holding these utilities to a very stringent examination of alternatives. As such, there is a real risk that these plants will become stranded assets in the future.
According to FERC, another 80 MW-AC was put online in the “other” category. This category casts a wide net, including everything from plants that burn tires to battery projects and fuel cells. Given the current growth rates in battery storage, FERC may want to consider disaggregating this category.
This content is protected by copyright and may not be reused. If you want to cooperate with us and would like to reuse some of our content, please contact: editors@pv-magazine.com.



“According to FERC, another 80 MW-AC was put online in the “other” category. This category casts a wide net, including everything from plants that burn tires to battery projects and fuel cells. Given the current growth rates in battery storage, FERC may want to consider disaggregating this category.”
Ya think? Wow, what a clustered mess.