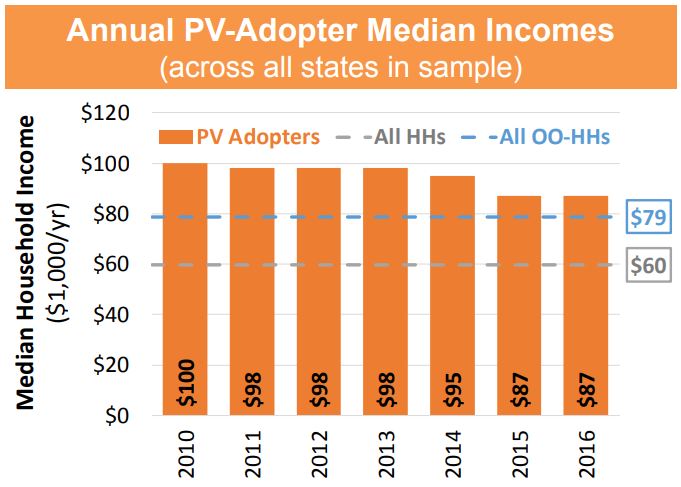
Solar power is still a premium item for a homeowner to purchase. However, as the pricing and finance techniques of solar power have evolved, so has the profile of the typical PV system owner. With data starting in 2010, we’ve seen the median incomes of pv adopters fall from $100,000 to $87,000 in 2016. However, researchers caution that as the U.S. is a 50 state market with each state having unique characteristics, as such local research based upon state level goals is needed to understand the characteristics of each market.
The research (PDF slide presentation) by the U.S. Department of Energy’s Lawrence Berkeley National Laboratory (LBNL) focused on trends among U.S. residential solar adopters, specifically highlighting low and moderate-income household patterns. The document suggests a high level of data accuracy due to house-level valuationw and a dataset covering more than 800,000 installations, representing 82% of all U.S. residential installations by the end of 2016.
Considering all data back to 2010, solar power adopters show an annual income of roughly $92,000/year – $32,000 higher than the median for all U.S. households of $60,000/year at the end of 2016. If we focus only on owner-occupied households, we find the difference in annual income narrows to $13,000, as those owner occupied homes are earning a median income of $79,000/year.
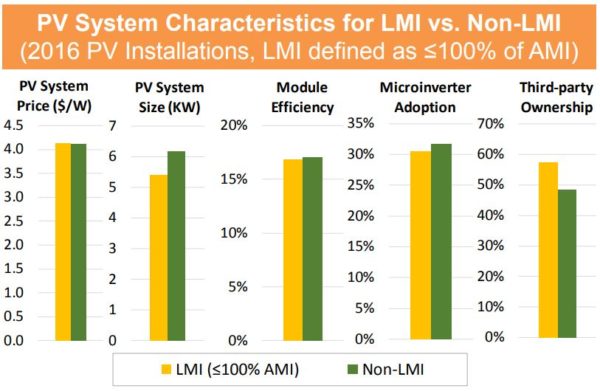
The analysis does look at third party ownership, and we do see a heavier amount of third party ownership in low and moderate income households. For the dataset of low and moderate income homes with solar, 57% of those homes host third party-owned solar versus 48% of the PV systems on high income households being third party owned.
pv magazine feels the uniqueness of third party ownership versus direct ownership is deserving of further data analysis to see sub-trends in direct ownership. What is interesting about higher levels of third party party ownership among low to moderate incomes families is that you might expect credit challenges, while critics argue that this represents financial companies seeing prey.
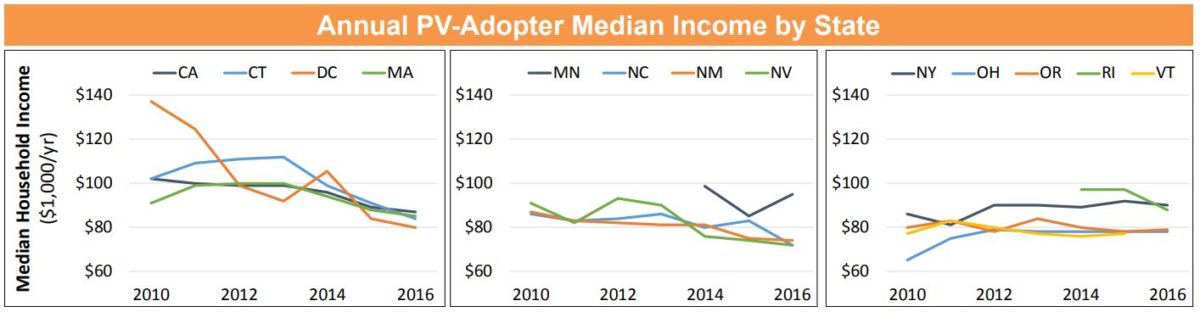
Multiple data artifacts show the uniqueness of the fragmented state markets – more reasons why the solar industry has resisted national chains when it come to construction of residential and commercial solar. For instance, in three regions – Washington DC, Connecticut and Massachusetts – the income of PV adopters is actually lower than the median of those states. These states also have higher median incomes versus the national average, and have supportive solar power legislation.
There are also batches of states that have comparable income pattern changes.
It is from these areas where we see the researchers communicate the importance of a state-level focus when considering future policy changes. Every state within the United States has unique characteristics, including variations in state level incentives, electricity market laws, prices of energy, contracting law, permitting law, as well their own socio-economic patterns, which need to be taken into consideration when considering how to address its own market challenges. Federal lawmakers should also take into consideration their chosen manner of supporting solar power – tax credits – and how this particular form of incentive may have slowed the progression of solar toward the masses.
This content is protected by copyright and may not be reused. If you want to cooperate with us and would like to reuse some of our content, please contact: editors@pv-magazine.com.


By submitting this form you agree to pv magazine using your data for the purposes of publishing your comment.
Your personal data will only be disclosed or otherwise transmitted to third parties for the purposes of spam filtering or if this is necessary for technical maintenance of the website. Any other transfer to third parties will not take place unless this is justified on the basis of applicable data protection regulations or if pv magazine is legally obliged to do so.
You may revoke this consent at any time with effect for the future, in which case your personal data will be deleted immediately. Otherwise, your data will be deleted if pv magazine has processed your request or the purpose of data storage is fulfilled.
Further information on data privacy can be found in our Data Protection Policy.