pv magazine: What is the difference between the Vaisala weather data compared to data sets which are available for free? Don’t they come from the same satellites?
Gwen Bender: All satellite based datasets come primarily from the same satellite imagery. But the different providers use various additional input data sources for critical components like aerosol data (dust, pollution, snow cover, etc.). We also use different algorithms for converting the pictures we get from the satellites into estimates of clear sky and cloud index conditions, which are how you determine irradiance from what are essentially black and white images of cloud cover.
Our understanding of how to implement the clear sky algorithms has certainly advanced over the years, as have the aerosol inputs. So getting a dataset that uses up-to-date methodologies is important. Vaisala actually maintains 5 different “datasets” which all use the same underlying satellite imagery but employ two different clear sky algorithms and 3 different aerosol inputs and we let our clients compare all of them in our online tools.
How do you catch the trends with these data sets?
Gwen Bender: The time component is important. If you’re using a public dataset such as NASA or even Meteonorm (which ends 10 years ago) you aren’t capturing the current climate conditions that you’ll be operating in! This has a big impact in regions that have seen dramatic increases in pollution such as China and India.
There are also big differences in accuracy between the public models and private datasets such as Vaisala’s. Most of the public models have uncertainty ranges that are 10-12% or higher. Whereas providers like Vaisala have global uncertainty ranges of 5-6% and in some regions it is much lower depending on the version of the dataset being considered. We also support our clients in their development efforts and will defend our work to their financial partners if necessary, support you can’t get from public providers.
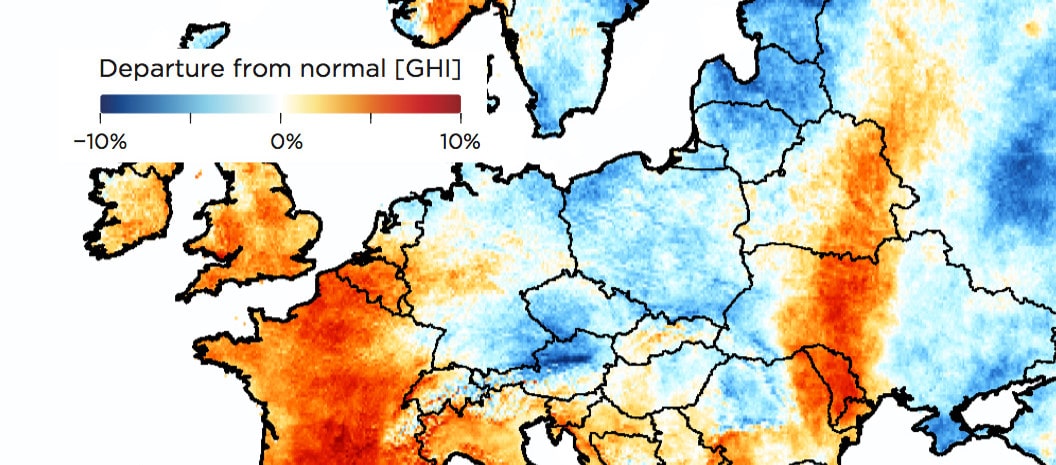
pv magazine: How much does the irradiation of one year deviate from the long term average in general and at maximum, and how does this depend on the location?
Gwen Bender: Different locations vary on an inter-annual basis in how much the irradiance can deviate. Typically we only see a swing of 1-3% at most locations on a year-to-year basis but it can be as high as 5%. We do see variation from the long-term average of 5-10% any particular year and that’s not unusual (see anomaly maps). And certainly on a monthly basis it can get as high as 20% deviation from the long-term average!
Depending on how you did your pre-construction estimate this kind of variation may come as a surprise to you. It is not uncommon for estimates to use the long-term average, or P50, and then assume a typical inter-annual variation of 2%. For some locations this is overly conservative and for others it is under predicting. With datasets like Vaisala’s easily available globally there is no reason one can’t have an accurate estimate of long-term variability that is customized for their project location.
Interview by Michael Fuhs
Next free pv magazine webinars:
For readers in Europe and at the East Coast: Reducing Costs with Smart Maintenance in Solar Asset Management
For readers in Asia and in Europe: Best Practices for PV Project Development
For readers in the Americas: Reducing Solar Performance Uncertainty
Participants will receive FREE access to Vaisala’s solar resource data base through new online tools for two weeks.
This content is protected by copyright and may not be reused. If you want to cooperate with us and would like to reuse some of our content, please contact: editors@pv-magazine.com.


By submitting this form you agree to pv magazine using your data for the purposes of publishing your comment.
Your personal data will only be disclosed or otherwise transmitted to third parties for the purposes of spam filtering or if this is necessary for technical maintenance of the website. Any other transfer to third parties will not take place unless this is justified on the basis of applicable data protection regulations or if pv magazine is legally obliged to do so.
You may revoke this consent at any time with effect for the future, in which case your personal data will be deleted immediately. Otherwise, your data will be deleted if pv magazine has processed your request or the purpose of data storage is fulfilled.
Further information on data privacy can be found in our Data Protection Policy.