
Ten years ago it was easy to think that solar and wind weren’t going to be a major part of our electricity system. With less than 1 gigawatt (GW) installed nationally – and not much outside of California – solar was a mere drop in the 1 terawatt ocean of U.S. electricity capacity, and met 0.1% of electricity demand in 2008. Wind was further along, but the 25 GW of wind that had been installed still met less than 1.5% of U.S. electricity demand.
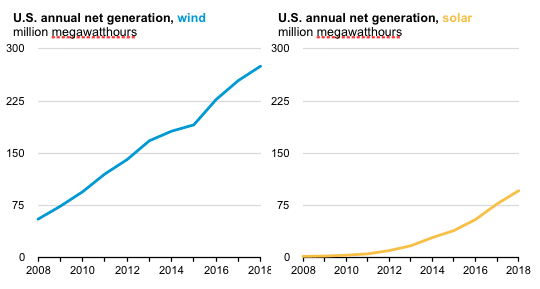
However, in the past 11 years everything has changed. The volume of solar deployed climbed each year to reach more than 64 GW, and the electricity generated from solar grew 48x from less than 2 terawatt-hours (TWh) in 2008 to 96 TWh in 2018. Wind grew more slowly, but output still increased 5x to reach 275 TWh. In 2018, solar and wind together met 8.9% of U.S. power demand, with solar alone contributing 2.4%.
Overall electricity demand over this period was relatively flat, and with nuclear generation also largely unchanged, solar and wind began to eat into the market share of coal and to a lesser degree gas. While this has been exciting, it is only the beginning, and the real question is what will happen from here.
Exponential growth
There is much more wind deployed than solar in the United States, and the volume of wind turbines erected has swung wildly from year to year, usually depending on the status of the federal Production Tax Credit. However, over the past 11 years the average volume of wind turbines going up each year hasn’t shown much of an increase or decrease.
Changes in capacity factors have not been the primary cause of the growth over this time period*; instead as wind deployment grew so did the volume of electricity generation from wind. The same is true for solar, but it is worth noting that for both resources the growth in electricity generation in any given year is more a reflection of what was installed the previous year.
At 2.4% of all power, solar isn’t a major component of the U.S. electricity system. But the promise of solar is that, generally speaking, every year the amount of solar added to the U.S. electricity mix increases. Looking back over the last 11 years, the amount of electricity generation from solar grew at an average of 47% each year, meaning that the cumulative volume deployed & electricity output were doubling in an average of less than two years.
The difference between the roughly linear progression of electricity generation from wind and the exponential increase in solar can be seen in the following two charts.
Elon Musk once noted in a Tesla results call that exponential growth is difficult for humans to visualize. While this may be true, there is another problem that anyone making predictions that are used for business decisions faces: While you may be off forecasting based on linear growth, you could be off wildly in any given year if you try to forecast exponential growth.
This and an institutional conservatism may be reasons why analysts have repeatedly failed to accurately forecast the growth of wind and solar. While forecasts such as those put out by the International Energy Agency and other institutions are now openly mocked in energy circles for their terrible track record and inability to adapt, private analysts have routinely under-estimated the growth of renewable energy as well.
A closer look at 2018 and 2019
Before we take a look at what the future holds, it is important to understand what happened in the last few years with solar deployment.
Solar’s very strong growth rate has been consistent until relatively recently. While the volume of electricity generated from solar increased more than 40% in 2015, 2016 and 2017, due to the artificial market spike in 2016 caused by the scheduled drop-down of the Investment Tax Credit (ITC) and the resulting market correction in 2017, electricity generation from solar grew only 24% from 2017 to 2018.
2019 is also shaping up to be slower growth than the previous 11-year average. Largely due to the market interruption from the Section 201 tariffs, 2018 installations were slightly below 2017 levels. Regardless, Bloomberg New Energy Finance expects the growth rate of electricity generation from solar to increase to 30% in 2019.
Future growth rates
All major analysts expect a boom in utility-scale solar and wind installations as long as tax credits hold out, which means a boom in wind deployment in 2019, and solar through at least the end of 2021. But it is not clear what will happen after that.
If electricity generation from solar were to keep an average growth rate of 40% annually, then by 2030 it would generate enough power to meet more than our entire present electricity demand.
But while electricity consumption is likely to increase due to the rise of electric vehicles and the electrification of other sectors such as heating, not even pv magazine USA’s writers expect the growth rate of the next 11 years to match that of the 2008-2018 period.
By contrast, if the growth rate of solar were to fall to a roughly linear progression over the next 11 years, we wouldn’t even be at 10% solar by 2030. While analysts are predicting this sort of linear growth, this assumes that exponential growth has already stopped – an assumption that has been made repeatedly and proven wrong repeatedly in the past.
So if the truth lies between these two extremes, how much will solar grow? No one knows.
Devil, details
The numbers of actual deployment and electricity generation in each year gloss over the real-world events that greatly determine the actions of markets.
Chief among these is policy, and the trend in policies towards mandating higher levels of renewable energy shows an acceleration. Six states (California, Hawaii, New Jersey, New Mexico, New York and Vermont) have mandates to reach at least 50% renewable energy by 2030, as does Washington D.C. Puerto Rico is expected to have a similar policy within weeks. Together, these eight jurisdictions represent 23% of the U.S. population, and California, which represents half of this, is ahead of its RPS targets.
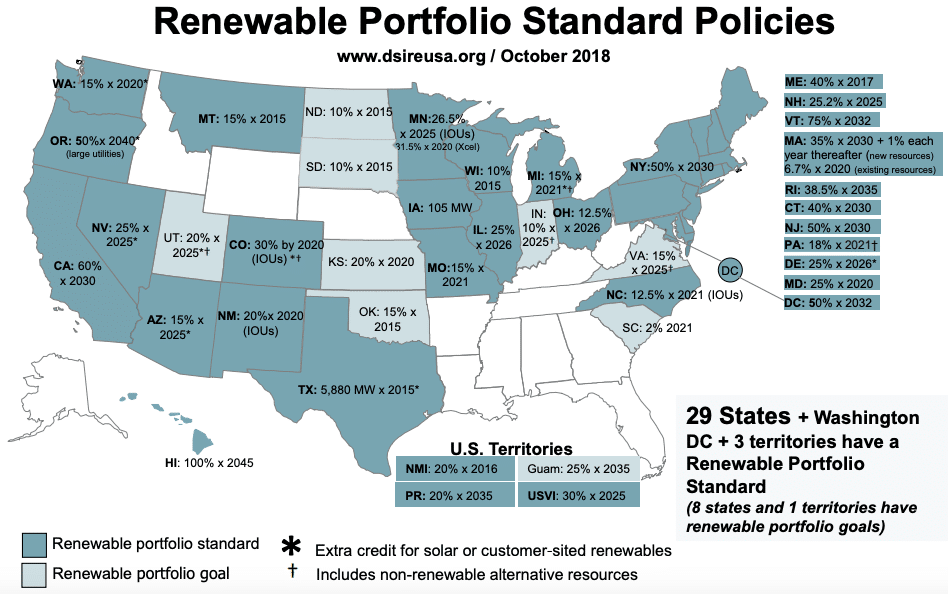
Graphic: DSIREusa.org
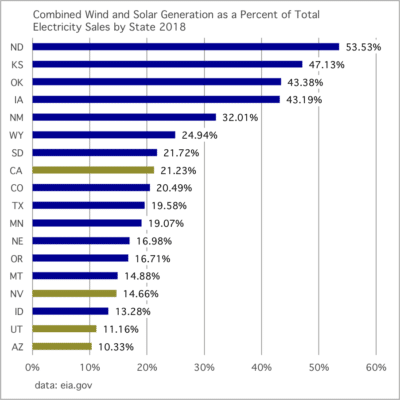
And the states which have deployed the most wind to date don’t have meaningful renewable energy mandates. Texas has deployed more wind than any other state, and got 19% of its electricity from wind in 2018. Last year North Dakota become the first state to meet more than 50% of in-state demand with wind, and all the Plains States are leaders in the portion of demand met by wind.
 Looking at these two trends together, the combination of states with aggressive renewable energy mandates and those that are already deploying high levels of renewables due to raw economics could push the United States to much higher levels.
Even so, some regions are lagging well behind others. Despite aggressive policies in New York, New Jersey and other locations, the U.S. East Coast – the most densely populated region in the nation – has been much slower to decarbonize, and both weaker wind and solar resources along with difficulty in siting projects likely play roles in this.
At the end of the day, there is no deterministic answer to how much wind and solar we will deploy in the next 11 years, and how much electricity these sources will generate. While economics plays a strong role the future is not written yet, and it will be a choice whether or not we decarbonize rapidly using renewable energy.
What the next 11 years bring is up to all of us.
Editor’s note: Capacity factors for turbines have increased, but wind is also increasingly being sited in less productive locations, meaning less meaningful change in the overall capacity factor. Solar has shown a slower increase in module efficiencies, and while the adoption of single-axis tracking and other non-module innovations have increased the capacity factor of systems, more solar is likewise being sited in less productive locations than in previous years.
This content is protected by copyright and may not be reused. If you want to cooperate with us and would like to reuse some of our content, please contact: editors@pv-magazine.com.


PV electric will follow led lights in cost, sales, and the exponential growth. Since they are semiconductors like computers every 5 years half the cost and then more installations. Public
does not trust what nuclear power tells us with Chernobyl and Fukashima clean up costs adding
to cost and like the Titanic people thought it “unsinkable”. No nuclear wastes and lots of sunshine
in Sahara and the middle east.
The world needs about 64 TW peak of solar and wind to achieve today’s 16TW average total energy demand (not just electricity).. If we use solar pv’s 30 year life, we have to replace about 2 TW per year. We are only producing 100 GW per year (solar). We need to increase at least to 20 times to ever reach 100% renewable.
There is no reason for the slowdown in doubling rates except fossil and nuclear attacks via pr and political influence, which are obvious.
Solar and wind are cheaper and faster to install. They are 100’s of times cleaner and less health damaging pollution, the emits no GHG.
Sale don’t slow down when things get cheaper and better without outside influences.