December’s solar resource across North America reflected a classic La Niña pattern, as demonstrated in this analysis using the Solcast API. A persistent subtropical ridge over the southwestern United States suppressed solar generation across the Pacific Northwest and western Canada, whilst driving above-normal conditions from the Southwest through the Great Plains. This blocking configuration diverted storm tracks northward while allowing dry subtropical air to dominate much of the southern tier.
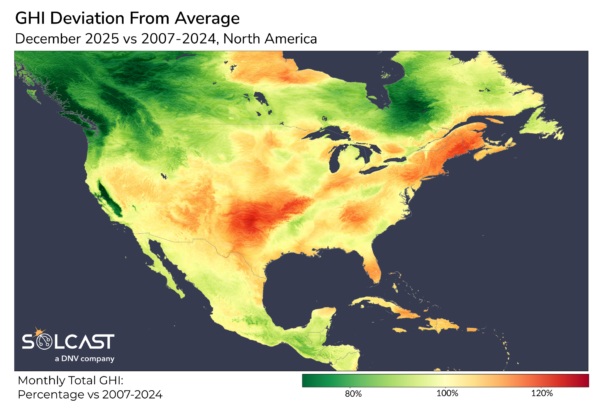
The first driver was a strong ridge anchored over the Southwest, which acted as a blocking high. This feature forced the Pacific jet stream north into British Columbia and Alberta, steering storm systems away from the U.S. West Coast. As a result, the Pacific Northwest and western Canada recorded irradiance 20% to 30% below normal, consistent with frequent cloud cover and moisture-laden air. Baja California and northern Mexico also saw slightly below-normal values, as subtropical moisture occasionally intruded along the southern fringe.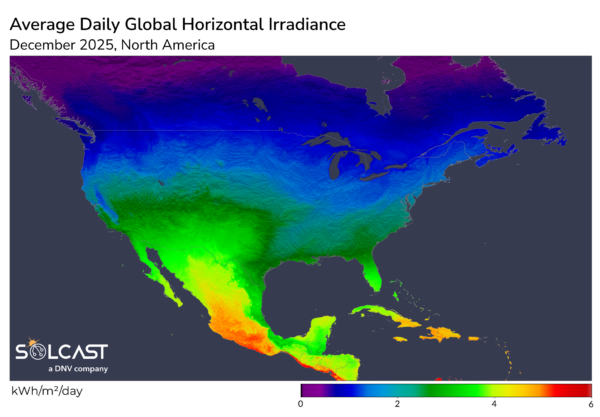
In contrast, regions under the ridge experienced subsidence and clear skies. From Arizona across Texas and into the Southern Plains, irradiance ran 10% to 20% above normal. Dry air advection extended this anomaly toward the Gulf Coast, reinforcing the sunny pattern. This configuration—wet Mexico paired with a dominant Southwest ridge—is a hallmark of La Niña winters. For solar operators, the practical impact was significant: assets in Arizona and Texas likely exceeded typical December irradiance by 10% to 15%. Solcast Grid Aggregation models show ERCOT utility-scale solar generation was 8.09% higher than average December conditions.

As continued from November, California’s central valley was impacted by tule fog for much of December, severely impacting solar assets in the region, with some fog-impacted parts of California seeing less irradiance than Toronto.

Overall, December’s irradiance map was shaped by a classic atmospheric setup: a blocking ridge suppressing Pacific storm tracks and amplifying contrasts between cloudy northern latitudes and clear southern skies. These dynamics underscore how large-scale circulation patterns can create sharp regional differences in solar resource availability.
Solcast produces these figures by tracking clouds and aerosols at 1-2km resolution globally, using satellite data and proprietary AI/ML algorithms. This data is used to drive irradiance models, enabling Solcast to calculate irradiance at high resolution, with typical bias of less than 2%, and also cloud-tracking forecasts. This data is used by more than 350 companies managing over 300 GW of solar assets globally.
The views and opinions expressed in this article are the author’s own, and do not necessarily reflect those held by pv magazine.
This content is protected by copyright and may not be reused. If you want to cooperate with us and would like to reuse some of our content, please contact: editors@pv-magazine.com.


By submitting this form you agree to pv magazine using your data for the purposes of publishing your comment.
Your personal data will only be disclosed or otherwise transmitted to third parties for the purposes of spam filtering or if this is necessary for technical maintenance of the website. Any other transfer to third parties will not take place unless this is justified on the basis of applicable data protection regulations or if pv magazine is legally obliged to do so.
You may revoke this consent at any time with effect for the future, in which case your personal data will be deleted immediately. Otherwise, your data will be deleted if pv magazine has processed your request or the purpose of data storage is fulfilled.
Further information on data privacy can be found in our Data Protection Policy.