Renewable energy deployment fell well short of expectations last year, adding 16% less capacity in 2022 than in 2021. As components, shipping and grid interconnection costs rose and trade wars unfolded, supply chains struggled to keep up with planned projects. The drop in deployment occurred in a year where 30% growth was expected.
The American Clean Power Association (ACP) reported that renewable energy deployment began to ramp up in Q4 of 2022. Developers added 131 projects across 36 states in Q4, 2022, adding roughly 30% of the projects brought online in 2022. Texas accounted for 44% of Q4 installations.
Despite this increase in activity late in the year, Q4 2022 showed the lowest fourth quarter deployment since the onset of the COVID-19 pandemic in Q4, 2019.
The 16% decline in clean power installations in 2022 versus 2021 can be explained in part by the mass of projects that have experienced project delays in 2022, the ACP said. More than 48 GW of clean power projects reported delays in 2022 and have not yet come online.
Solar accounts for 64% of the capacity of delayed clean power deployment. More than 4 GW of clean power projects have been permanently terminated since the beginning of 2021.
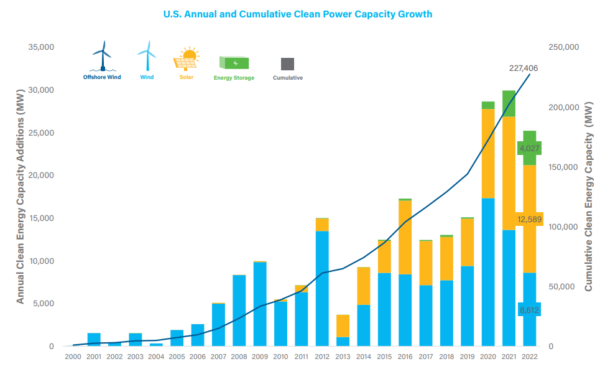
However, solar had its strongest Q4 yet, adding 4.7 GW, 3% higher than Q4, 2021. Solar commissioned the most capacity among renewable energy projects, adding 12.7 GW in 2022. For the year’s sub-total, solar added 5% less capacity in 2022 than in 2021. This fell short of the anticipated 30% year-over-year growth.
Total operating clean power capacity, which ACP tracks as solar, wind, and energy storage development, has reached 227 GW, enough to power more than 61 million American homes.
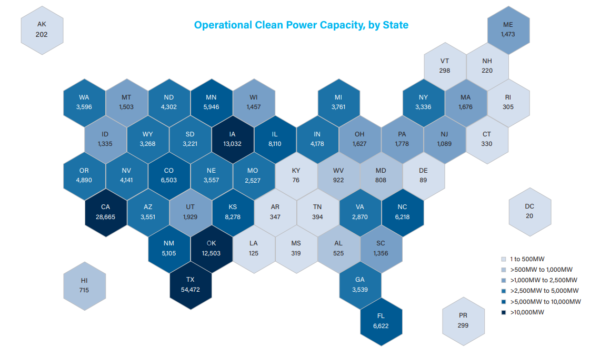
Texas leads the nation in terms of total operating clean power capacity (54 GW), as well as total land-based wind capacity (40 GW). California places second overall at 29 GW online, but first for solar (18 GW) and battery storage (5 GW). Iowa ranks third overall with 13 GW, almost all of which is wind power (12.7 GW).
Solar now represents 59% of the clean power capacity in development, gaining 4% in share, the ACP said. Texas leads with 17 GW of solar in development, representing 21% of the national solar development pipeline. This quarter California fell from second place in development, surpassed by Indiana with 6.2 GW in development. California has 6 GW of solar in its development pipeline.
Regionally, 95% of the non-ISO Southeast’s pipeline is solar, followed by MISO, with a pipeline of 77% solar. Solar makes up the smallest portion of the pipeline in ISO-NE at 16%.
Battery energy storage had a record year, adding 4 GW / 12.2 GWh, a significant leap over the 2021 total of 3 GW / 9.5 GWh. Storage capacity increased 80% in 2022. Following small declines in the second and third quarters, battery energy storage rebounded in Q4, growing 17% from Q3. As of December 2022, ACP said there was 16.7 GW/45.6 GWh of storage in development. Nearly 70% of the capacity is paired with on-site solar or wind capacity.
Hybrid projects, or ones that co-locate energy storage, have changed their profile considerably over the years. Almost 75% of all operating hybrid capacity is part of a solar plus storage project. That percentage increased by an average of 7% each year over the past decade, said ACP. Wind plus storage projects, which represented close to 75% of operating hybrid capacity a decade ago, now represents just 17% of operational capacity. The hybrid pipeline is 97% solar plus storage capacity and 3% wind plus storage project capacity.
This content is protected by copyright and may not be reused. If you want to cooperate with us and would like to reuse some of our content, please contact: editors@pv-magazine.com.


By submitting this form you agree to pv magazine using your data for the purposes of publishing your comment.
Your personal data will only be disclosed or otherwise transmitted to third parties for the purposes of spam filtering or if this is necessary for technical maintenance of the website. Any other transfer to third parties will not take place unless this is justified on the basis of applicable data protection regulations or if pv magazine is legally obliged to do so.
You may revoke this consent at any time with effect for the future, in which case your personal data will be deleted immediately. Otherwise, your data will be deleted if pv magazine has processed your request or the purpose of data storage is fulfilled.
Further information on data privacy can be found in our Data Protection Policy.