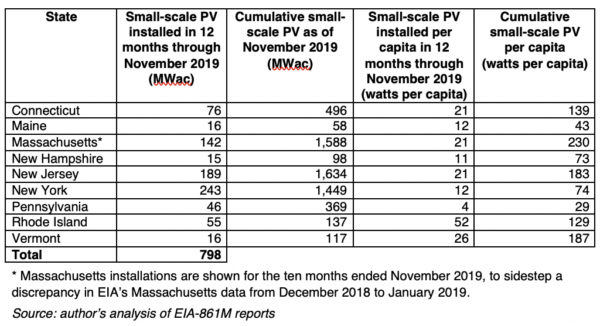
Solar contractors added about 800 MWac of small-scale solar across nine Northeastern states in the 12 months ending in November, 2019, with contractors in New York and New Jersey building three-fifths of the total installed capacity.
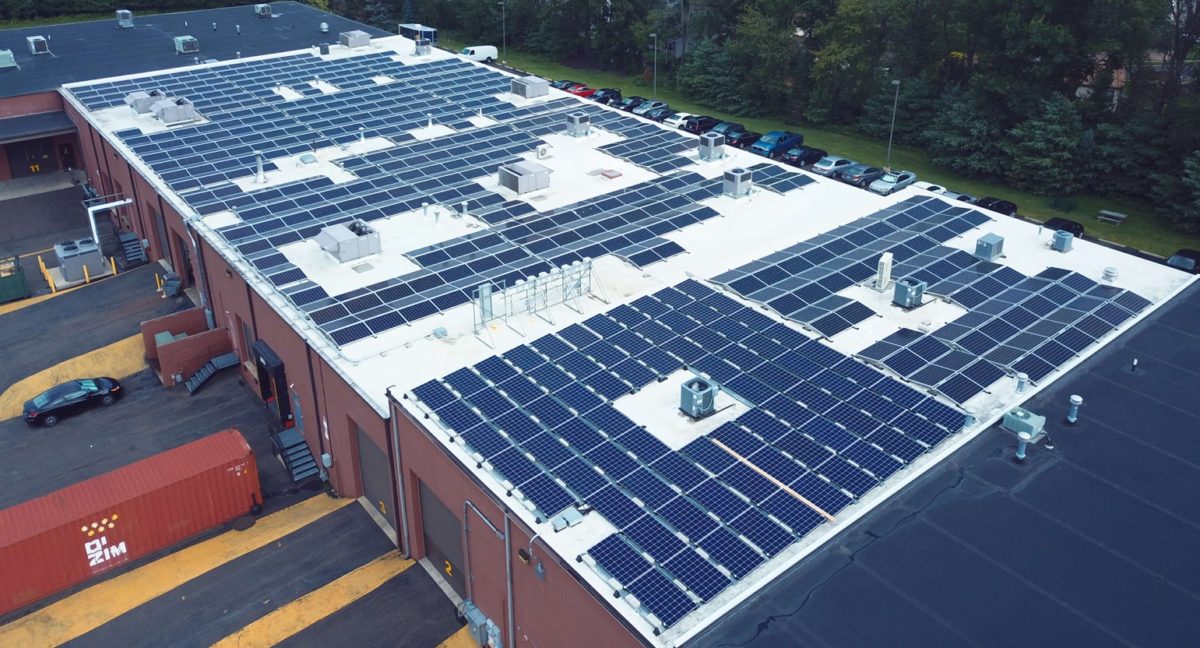
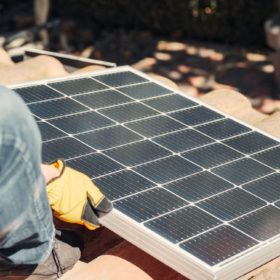
Small-scale installations, defined as those smaller than one megawatt, generally means rooftop solar.
Massachusetts kept the lead in cumulative small-scale PV per capita, while Vermont and New Jersey were neck-and-neck at second and third. Rhode Island contractors bested all comers last year in small-scale PV additions per capita, by a two-to-one margin.
All but two of the states exceed the U.S. national average of 69 watts of small-scale solar per capita, with New York and New Hampshire needing to maintain a healthy level of installations this year to maintain that honor.
Here are the results from the nine states, as reported in the federal Energy Information Administration’s Form EIA-861M data:
EIA does not collect data on all distributed solar installations, which are defined as those not directly connected to the bulk transmission system.
Policy goals
Because state policies are a major driver of the success of distributed solar, we invited several groups to share their policy goals for 2020.
New York: The Solar Energy Industries Association (SEIA) endorses a petition from the New York State agency NYSERDA requesting $573 million in state funding, to help meet a state target of 6 GW of distributed solar capacity by 2025. “SEIA will be supporting this expansion and ensuring NYSERDA’s plans help hit the target,” said David Gahl, SEIA’s senior director of Northeast state affairs.
Vote Solar will work to establish a goal in New York State of “serving 250,000 families in disadvantaged communities with solar so that everyone can participate in the clean energy revolution,” said Sean Garren, Vote Solar’s senior director for the Northeast. The NYSERDA petition includes a request for $135 million to benefit low-to-moderate income customers, but does not set a target for the number of families served.
Massachusetts: Under the Massachusetts SMART program of solar incentives, “less than 3% of the program has thus far served low-income customers,” said Garren of Vote Solar, pointing to a “too complicated” structure as the problem. The group aims for a simplified program “so that low-income families can get cost-saving solar without needing to sign a contract with a solar developer,” he said. Until then, the program should “reserve room for low-income customers within the program,” he added.
SEIA is focused on the project siting provisions of the SMART program. The program “applies an incentive subtractor for certain distributed solar projects built on greenfields and previously undisturbed property,” noted Gahl of SEIA. “This is essentially a penalty that’s assessed on a cent per kilowatt-hour basis. SEIA would like to develop a more granular approach that would more clearly designate the types of parcels where the subtractor would apply.”
New Jersey: New Jersey’s current incentive program for distributed solar is about to expire, said Gahl. This year, he said, SEIA is advocating for a successor program that will support at least another 3 GW of distributed solar development in the short term.
Vote Solar is advocating for $125 million per year in state funding to help 250,000 low-income families go solar by 2030, and install 400 megawatts of storage, said Pari Kasotia, Vote Solar’s Mid-Atlantic director. “By focusing on low-income families,” she said, “we are ensuring that on-bill savings, which are more difficult for low-income families to access, are available to everyone.”
Vermont: Renewable Energy Vermont, a SEIA state-level affiliate, is advocating for a 100% renewable electricity standard for the state, said the group’s Executive Director Olivia Campbell Andersen.
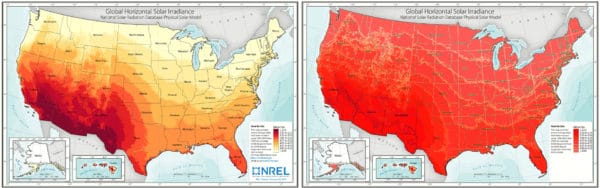
Northeast solar potential
The Northeast’s solar potential is shown in the maps below, with the map at right representing the highest potential as pure red, and the lowest potential, in the two northern bands, as pinkish red—as it is still 70% of the highest potential. Data for both maps are provided in the data key in the map at left.
This content is protected by copyright and may not be reused. If you want to cooperate with us and would like to reuse some of our content, please contact: editors@pv-magazine.com.


By submitting this form you agree to pv magazine using your data for the purposes of publishing your comment.
Your personal data will only be disclosed or otherwise transmitted to third parties for the purposes of spam filtering or if this is necessary for technical maintenance of the website. Any other transfer to third parties will not take place unless this is justified on the basis of applicable data protection regulations or if pv magazine is legally obliged to do so.
You may revoke this consent at any time with effect for the future, in which case your personal data will be deleted immediately. Otherwise, your data will be deleted if pv magazine has processed your request or the purpose of data storage is fulfilled.
Further information on data privacy can be found in our Data Protection Policy.