Researchers at New York’s Rochester Institute of Technology have found that, based upon an analysis of global market hotspots, homeowners will start to buy solar panels when they make about $1,000 per kilowatt installed in profit on their system.
Additionally, the paper – Empirical development of parsimonious model for international diffusion of residential solar – found that if politicians wanted to drive massive uptake, they’d start to see things happen around the first standard deviation at $3,000 per kilowatt of solar installed. At $7,100 per kilowatt earned, a tipping point would be reached where 50% of viable customers would be financially motivated to install.
Policy makers can use this data and the associated equations to structure financial incentives to meet explicitly defined residential rooftop solar power goals. The researchers suggest that this model be consulted because of its relative simplicity compared to models that include socioeconomic considerations.
When the data used to build the equations was charted below, we get to see a “who’s who” of historically important residential solar power markets, and what these markets looked like when they started to buy a lot of solar power. This was not the goal of the researchers, it just so happens these places had the best data to use.
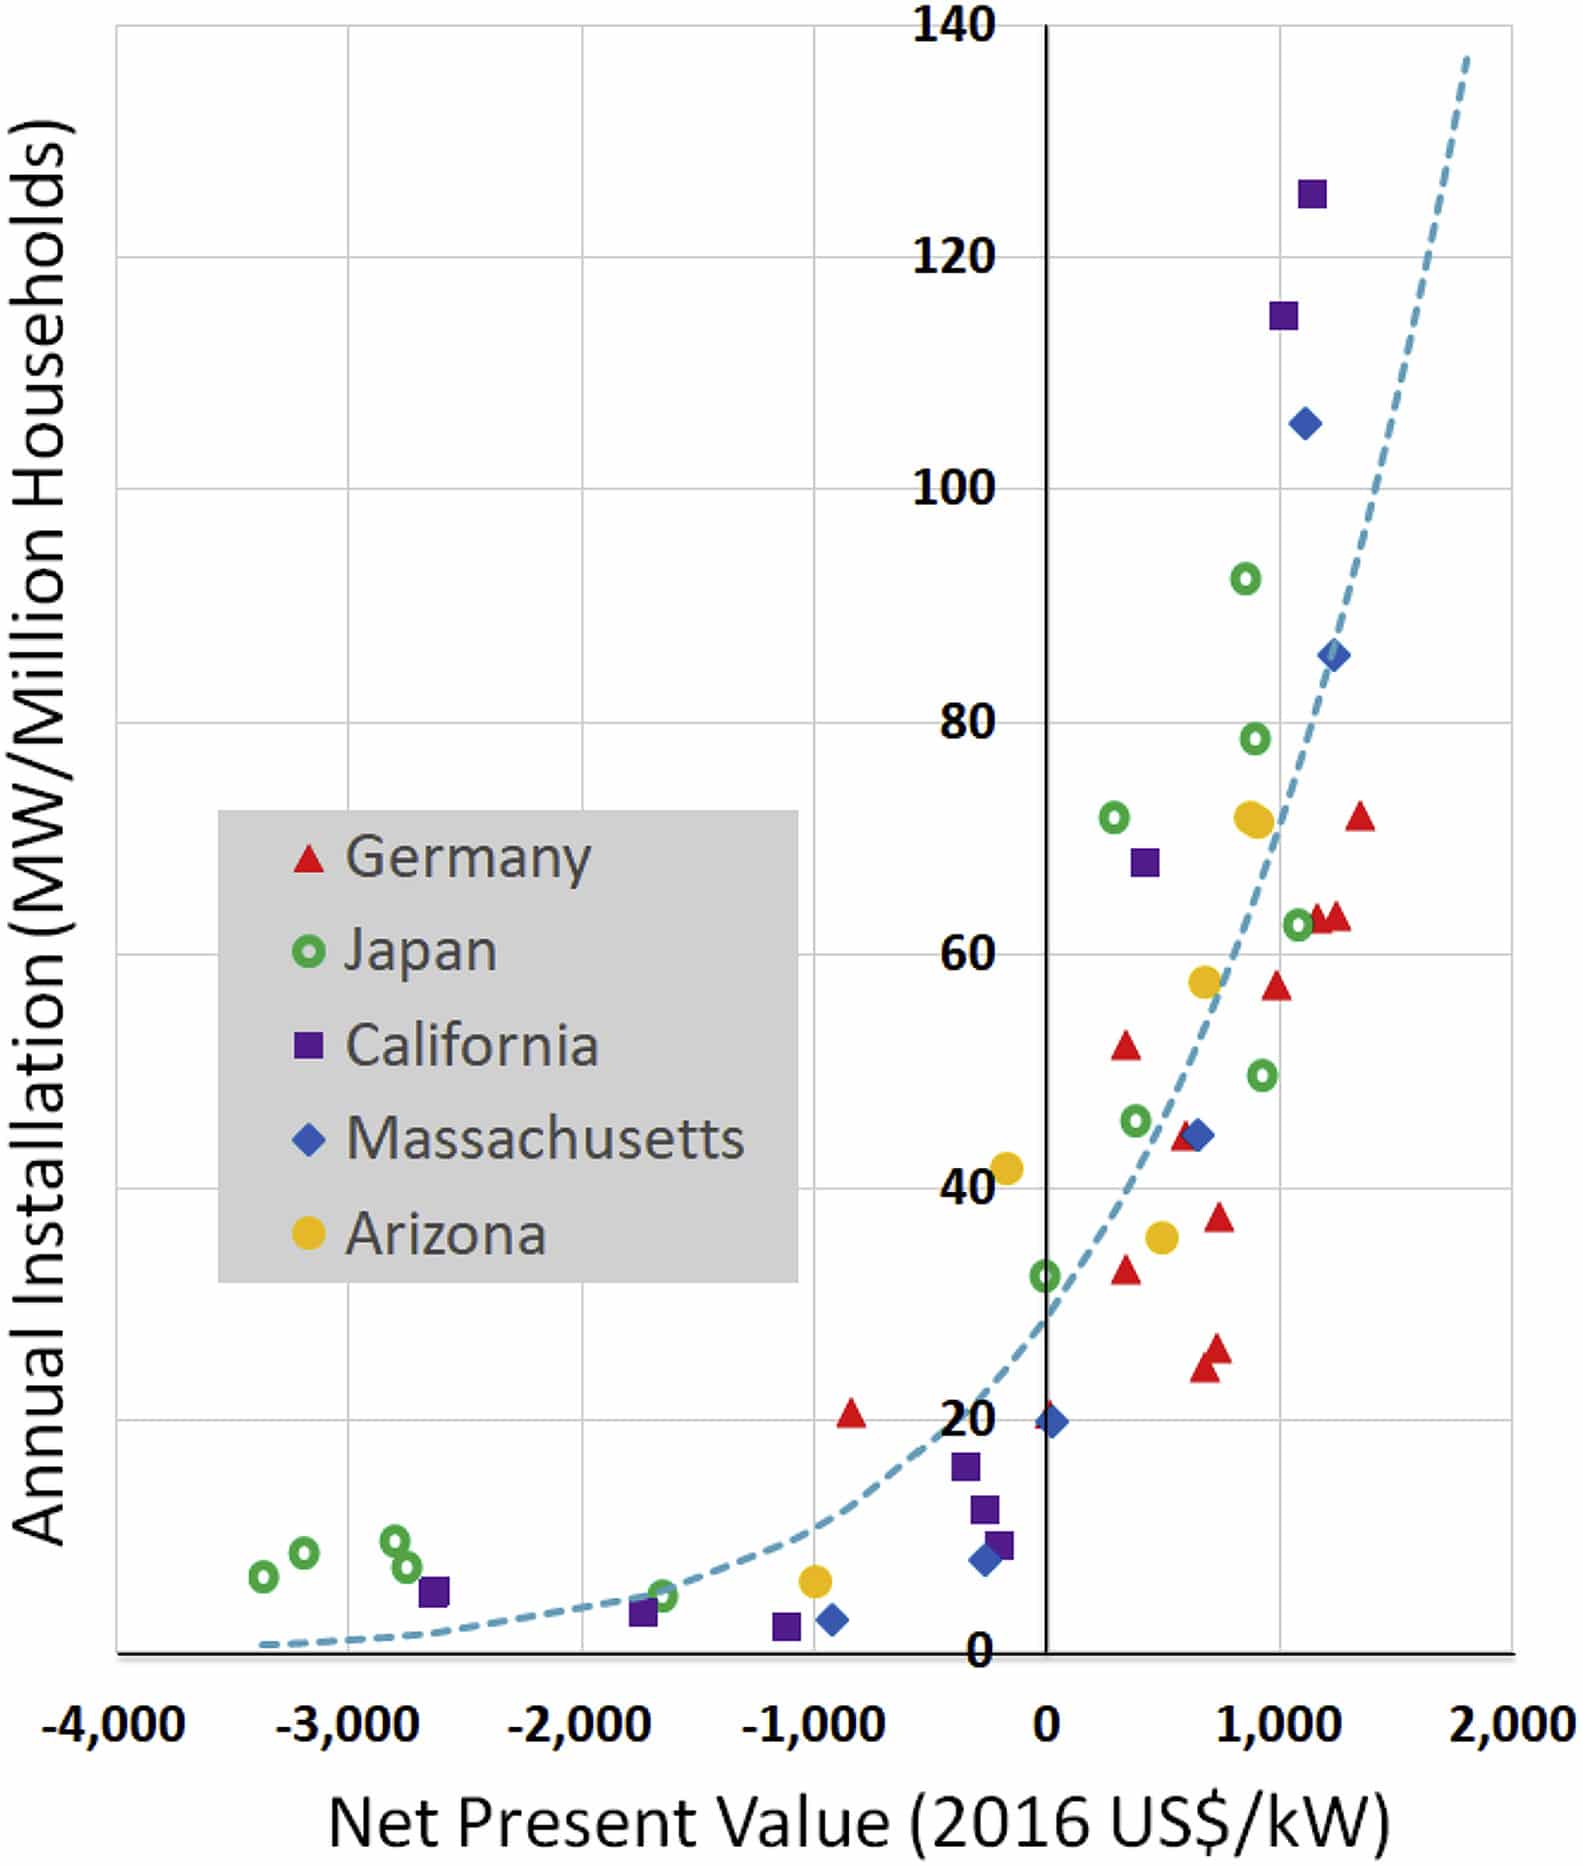
The bottom of the chart shows the additional value that a homeowner would earn per-kilowatt installed against other investments (the net present value) when installing the system in each of the locations. On the y-axis, the authors normalized the data to allow different-sized markets to look similar by predicting how much would be installed in each place if they all had the same “number of available detached homes in the region.”
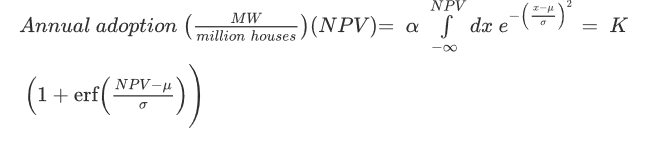
The dotted blue line in the chart – represented in the below equation – shows a kind of average between all of the data. Following along that line, would allow you to project the volume of solar that would be installed after subtracting household roofs that aren’t available for a large variety of reasons. For instance, the volume projected at $1,000/kW is 70 megawatts of solar installed per year – roughly 10,000 installs.
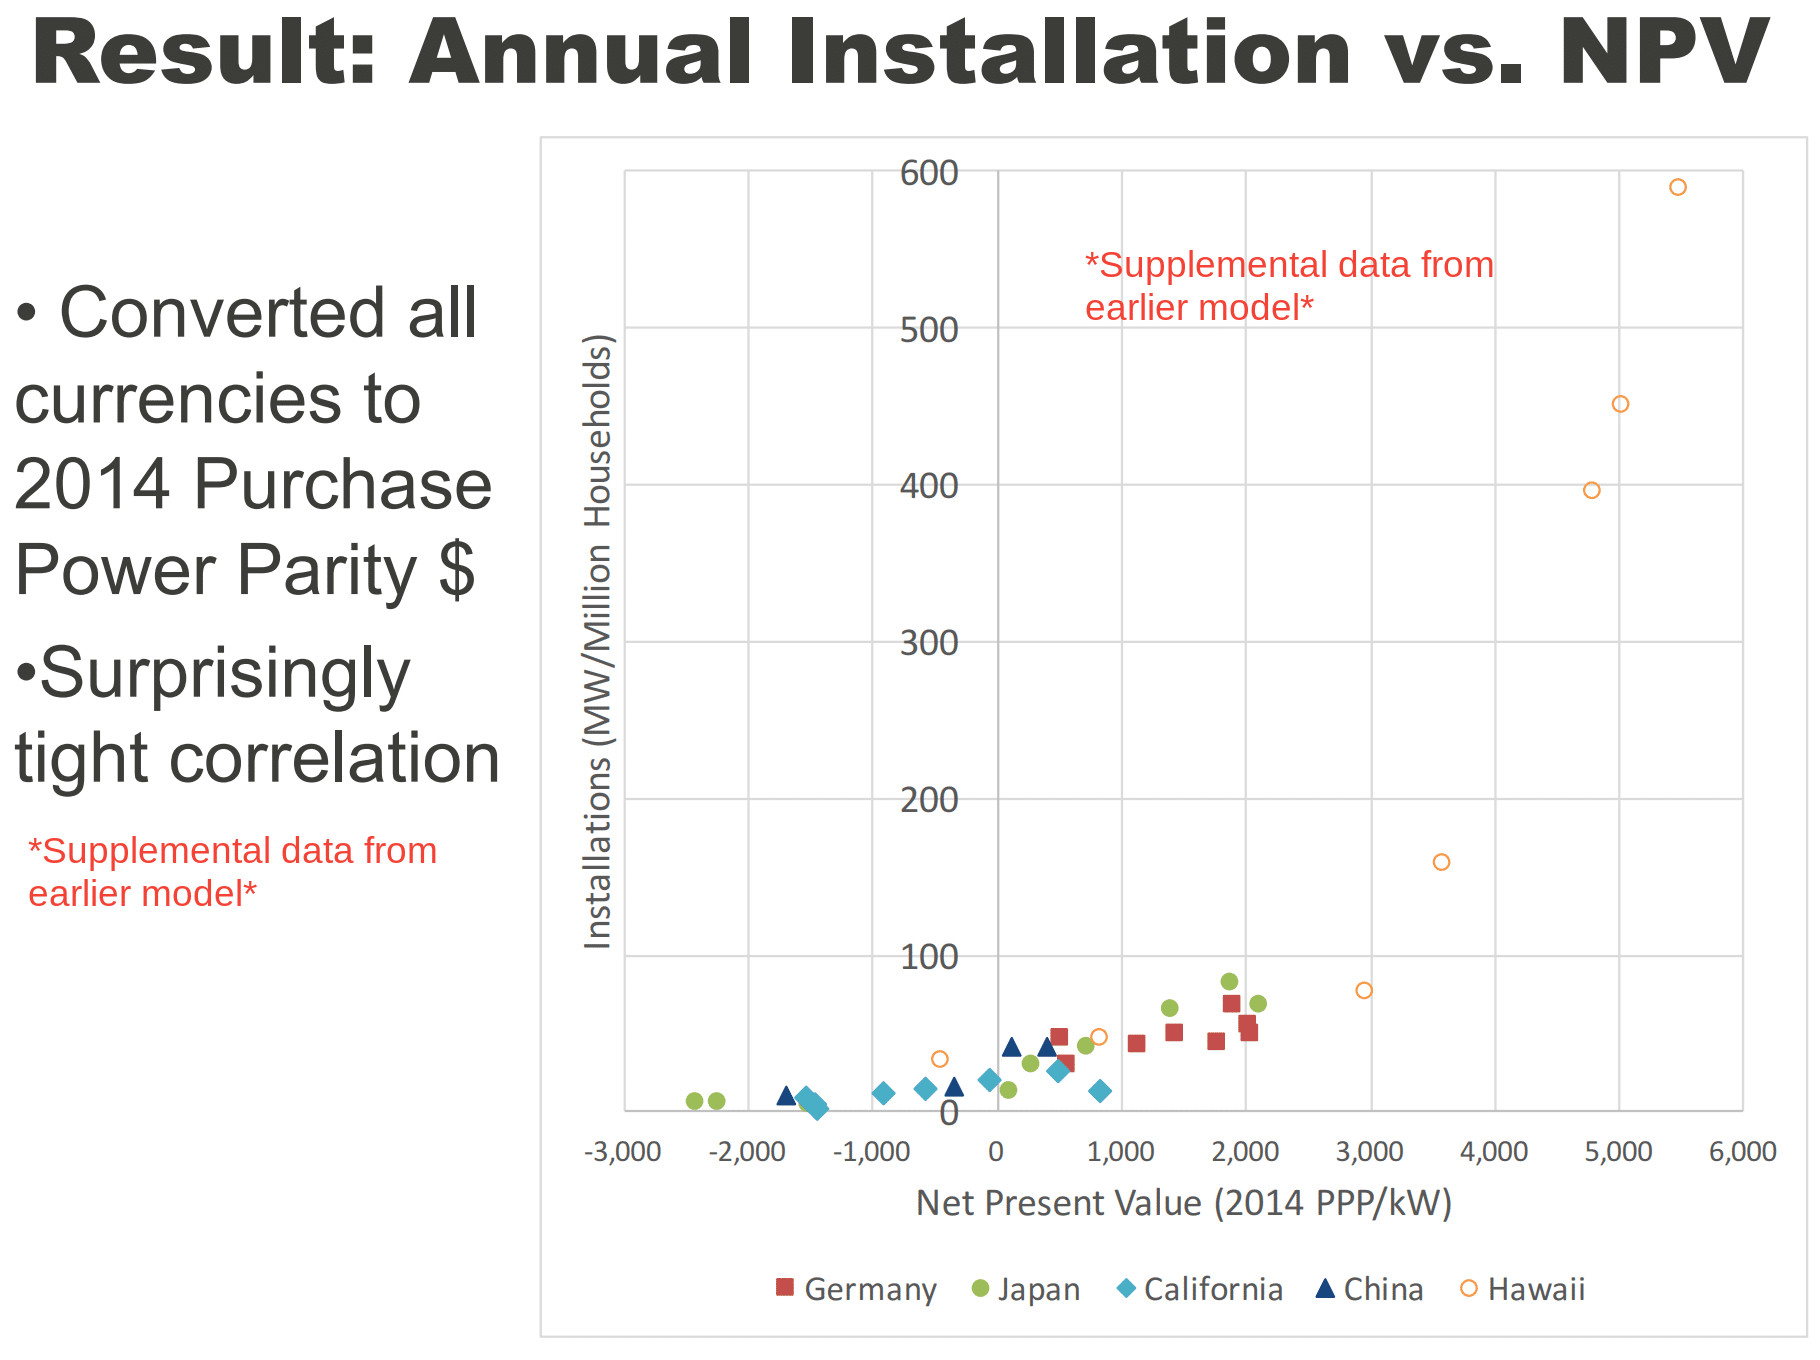
In speaking with researcher Eric Hittinger, pv magazine USA was told there was an additional set of data points – real life data – in their calculations that were removed because the market was deemed “different.” That market being – Hawaii.
In an earlier version of this work, we included data for Hawaii, which had better NPV and faster adoption. The points were pretty well on the same line, too. But the editing process suggested that we remove Hawaii because it was too different from the other locations.
The Hawaii data, shown below in a slightly different format that the above chart and not included in the published research, shows solar power rode the curve all the way up. Based on Hawaii’s history of canceling net metering along with homeowners no longer being allowed to export power during the solar window, one might wonder whether world markets could handle the tipping point just yet.
The researchers also developed two potential ways for policy makers to apply the equations when determining their incentive structures. The lower left chart represents the actual amount of subsidy that society pays – when accounting for those who might have bought anyway – when certain net present values are aimed for. The chart on the right gives an estimation on the social cost of carbon – to make the subsidy suggested socially viable. That chart varies based greatly upon solar resources.


While the authors aimed to support policy makers, one can imagine how a mathematically inclined residential solar contractor could make use of the equations. By using the net present values that motivate buyers, you have the ability to work the equation backwards to determine your local market’s viable cost per watt.
And if you have a million leads, but you only need sell ten projects to keep your business alive, then aim for a lower net present value – which is a higher price per watt – and take advantage of high construction margins. Inversely, if you want to increase your close rate, and increase your deal flow, lower your margins by pricing at a more agreeable point.
This content is protected by copyright and may not be reused. If you want to cooperate with us and would like to reuse some of our content, please contact: editors@pv-magazine.com.


Interesting, in some markets like California, the push is on for solar PV and energy storage. Bringing online larger energy storage systems in the neighborhood of 50 to 100kWh would solve a lot of bickering and rate spiking by the electric utilities that is causing high electric bills for all.
“At $7,100 per kilowatt earned, a tipping point would be reached where 50% of viable customers would be financially motivated to install.”
With smart energy storage, one might not need a large solar PV array on their roof. Overgeneration of solar PV could be stored during the peak solar day and used at night during a TOU rate period. At late night and early morning, the smart ESS could charge with off peak or super off peak power to address the home’s morning “wake up” power needs. Take a home of 2,000 square feet and make it look like a 1,000 square foot home or even a 500 square foot home to the electric utility, now how poetic is that?
It would be really helpful if, in articles like this, the author would include a link to the paper, or a reference, or at least a title.
Update: if you follow the link to the one named authors twitter, the link to the study is in there.
Generally I do, but I’ve got a new editor and my grammar and writing style is being refined, and I think we edited it out because I’d put it in the article quite grossly. 🙂 Expect to see it in the future.
Hey, this is your editor — communicating to you from under the bus which I have been thrown.
A solar powered bus 🙂
If you can’t update the article, then please put a link to the paper in the comments.
“Empirical development of parsimonious model for international diffusion of residential solar” – done and done