While 2016 was a banner year for the U.S. solar market, 2017 will see the market’s first year-over-year decline in the 21st century, according to the latest report by GTM Research and the Solar Energy Industries Association (SEIA). The Q1 2017 edition of the organizations’ U.S. Solar Market Insight report predicts that the U.S. solar market will decline 10% in 2017 to 13.2 GW, after reaching a high of 14.8 GW last year (increased from the previous estimate of 14.6 GW).
This predicted decline is another illustration of how incentive policies with sharp cut-off dates can wreak havoc on markets, even, as in this case, when the incentive is extended. The projected expiration of the federal Investment Tax Credit (ITC) drove a rush of solar development with projects planned for completion by the end of 2016, and many projects still met that deadline even after the ITC was extended in December 2015.
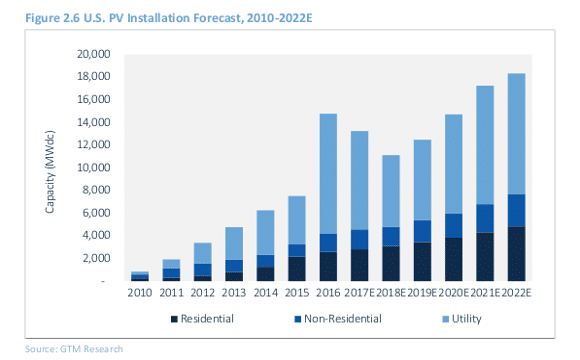
The build-out of this rush of utility-scale projects means that fewer will be built in 2017, particularly in states where utilities have already met renewable portfolio standard (RPS) requirements for several years in the future.
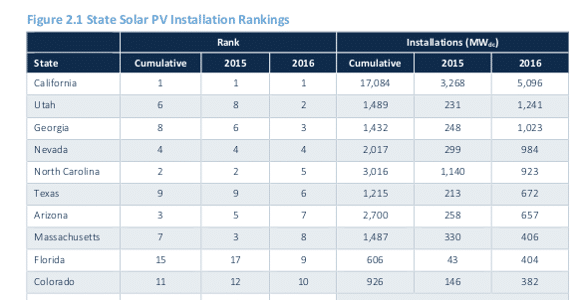
However, many of the biggest state markets in 2016 were not driven by RPS policies. Among the top 10 states for solar, only three – California, Massachusetts and Colorado – have robust RPS mandates.
In Utah and North Carolina – the #2 and #5 states for the most capacity added during 2016 – the biggest driver was the ability of developers to secure contracts under the Public Utility Regulatory Power Act of 1978 (PURPA). This semi-obscure law requires that utilities buy power from independent generators if that power is cheaper than what they forecast that they would otherwise pay.
In Georgia, the third-largest market, utility-scale solar was initially forced upon utility giant Southern Company by Republican state regulators. And in the fourth-largest market, Nevada, the desire of corporations to secure cheap renewable power has led to both utility defections and “green tariff” power contracts where Apple and other tech companies are buying power from solar projects through NV Energy.
All of this was enabled by falling prices, with GTM Research estimating that system prices fell 20% in 2016 – the biggest annual price decline since the company began compiling the Solar Market Insight report.
Outside the utility-scale market, GTM Research sees ongoing growth in both the residential and commercial and industrial (C&I) sectors. “Though utility PV will reset from an origination perspective starting in 2017-2018, distributed solar is largely expected to continue to grow over the next few years due to rapid system cost declines and a growing number of states reaching grid parity,” said Corey Honeyman, associate director of GTM Research.
However, this does not mean that it is all roses for either residential or C&I solar. Residential solar’s growth rate slowed to only 19% in 2016, and California’s residential solar market showed only single-digit growth, as much of the state transitions to “net metering 2.0”.
“Ongoing (net metering) and rate design battles – in conjunction with a declining incentive environment for non-residential PV – will continue to present risks to distributed solar growth,” warns Honeyman.
But while markets such as California cool down, the declining cost of solar is driving growth in a wider range of states across the nation. In 2016 a record 22 states installed more than 100 MW of solar, and GTM Research sees particular potential the fast-growing community solar market.
This content is protected by copyright and may not be reused. If you want to cooperate with us and would like to reuse some of our content, please contact: editors@pv-magazine.com.


By submitting this form you agree to pv magazine using your data for the purposes of publishing your comment.
Your personal data will only be disclosed or otherwise transmitted to third parties for the purposes of spam filtering or if this is necessary for technical maintenance of the website. Any other transfer to third parties will not take place unless this is justified on the basis of applicable data protection regulations or if pv magazine is legally obliged to do so.
You may revoke this consent at any time with effect for the future, in which case your personal data will be deleted immediately. Otherwise, your data will be deleted if pv magazine has processed your request or the purpose of data storage is fulfilled.
Further information on data privacy can be found in our Data Protection Policy.