Solar power has some magic numbers:
- Solar installations peak at 1,000 people per square mile
- Annual income of up to $150,000 per year is associated with more installations, after that it flattens out
- Poor people can’t afford it (even with expensive electricity and high sunlight)
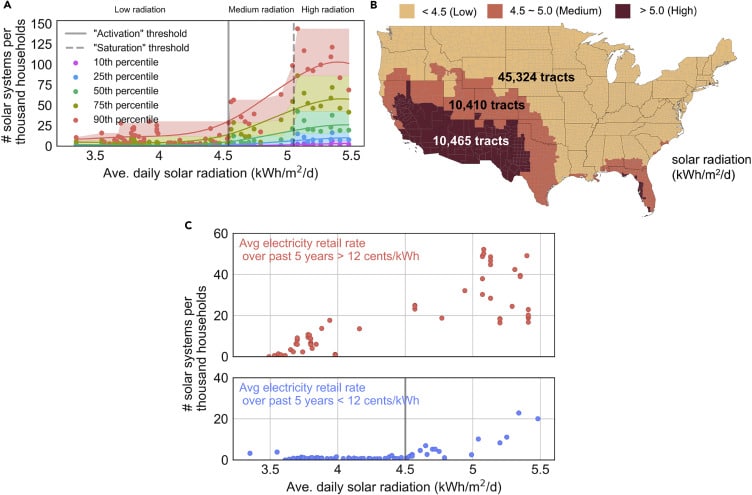
- Sunlight radiation greater than 4.5 kWh/m2/day triggers natural installations
- Educated people install more solar
Researchers at Stanford University, using machine learning and satellite imagery, have created a database of approximately 1.47 million solar power installations in the United States. And while having a map showing off the locations of installations is pretty cool – more important is the data representing why people might be installing.
The research showed that density sharply increases when solar radiation is above 4.5–5 kWh/m2/day. That means the southwest USA and Florida. However, higher levels of relative humidity predicted lower levels of installation volume – one reason Florida has fewer installations than the deserts of the Southwest
Socioeconomic factors also had a significant effect. For instance, in the below image top left, its noted that the more people live in a region the fewer residential solar power installations there are. This makes great sense since the most populated regions are cities with tall buildings, where there will be few t0 zero residential installations. Whereas Surburbia, with lower population densities, but many single family homes, shows a peak of over 50 solar installations per thousand households. Of note is Pasco, Florida having the highest level of installations in the United States
Household income, top right in below image, shows that once we start making a lot of money, we start installing solar power. This could be for several reasons. For instance, the graph notes that high incomes aren’t associated with more installations in Los Angeles, but this probably has to do with population density and single family homes.
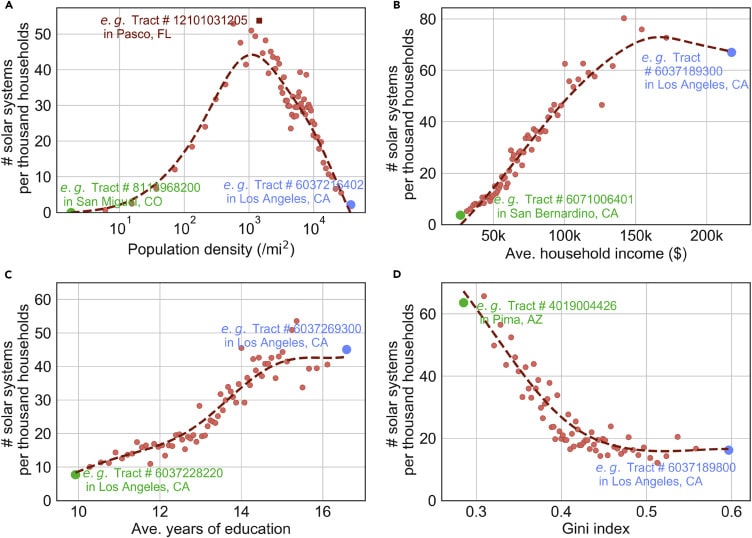
The lower left box, in the above image shows education, and that as education increases, so does the volume of solar power installed. These are two significant exceptions. One is that higher levels of sunlight dull the effect of education (common sense probably takes over), and again, when we consider higher levels of income. Note that Los Angeles is at the peak, so other factors may be affecting numbers. However, areas with higher education levels still install solar even in areas with less sunlight.
And of course, the rub of solar power – high capital outlay – means that poor and middle income people, even in areas with very high levels of solar radiation, mostly cannot afford solar power (lower right in above image).
This content is protected by copyright and may not be reused. If you want to cooperate with us and would like to reuse some of our content, please contact: editors@pv-magazine.com.


The Pasco county thing simply HAS to be a statistical anomaly! I Pasco is towards the lower end of the socio-economic scale (and as such I have to assume, the well-educated scale too) and is deeply ‘red’ (again, a link to it’s being less educated). living here, I just can’t wrap my head around this stat. I just got back from the San Diego area where solar is ubiquitous and it seemed that every 4th or 5th house was solarized. This just has to be a mistake.